Exploratory Data Analysis
LogML provides EDA (Exploratory Data Analysis) capabilities that could help users to quickly assess data and get some insights.
Configuration
Typical configuration file for EDA have the following structure (here and below diabetes dataset will be used):
 1version:                      0.2.6
 2
 3stratification:
 4    - strata_id:              low_age_group
 5      query:                  'Age < 29'
 6    - strata_id:              high_age_group
 7      query:                  'Age >= 29'
 8
 9eda:
10    enable:                   True
11    params:
12       correlation_threshold: 0.8
13
14report:
15    enable:                   True
16    report_structure:
17        eda:                  True
What it is all about:
‘stratification’ section defines strata of interest - EDA report will be generated for each stratum. Please see the corresponding class
logml.configuration.stratification.Stratafor details on how to define stratum. Within the configuration file above there 2 strata that are defined based on ‘Age’ column.‘eda’ section configures conditions under which EDA artifacts are generated, please see
logml.configuration.eda.EDAArtifactsGenerationSectionclass for details. Important parameters to consider:‘params’ (
logml.configuration.eda.EDAArtifactsGenerationParameters) - defines key parameters for artifacts generation (correlation artifacts are particularly affected).‘dataset_preprocessing’ (
logml.configuration.data_preprocessing.DatasetPreprocessingSection) - might be usefull in case additional transformations are required before doing EDA (apart from stratification-based filtering). For example columns filtering.
‘report’ section defines (via ‘report_structure’ subsection) a set of views that should be included into the result report. Please see
logml.configuration.baselinekit.BaselineKitStructurefor details on what views are available.
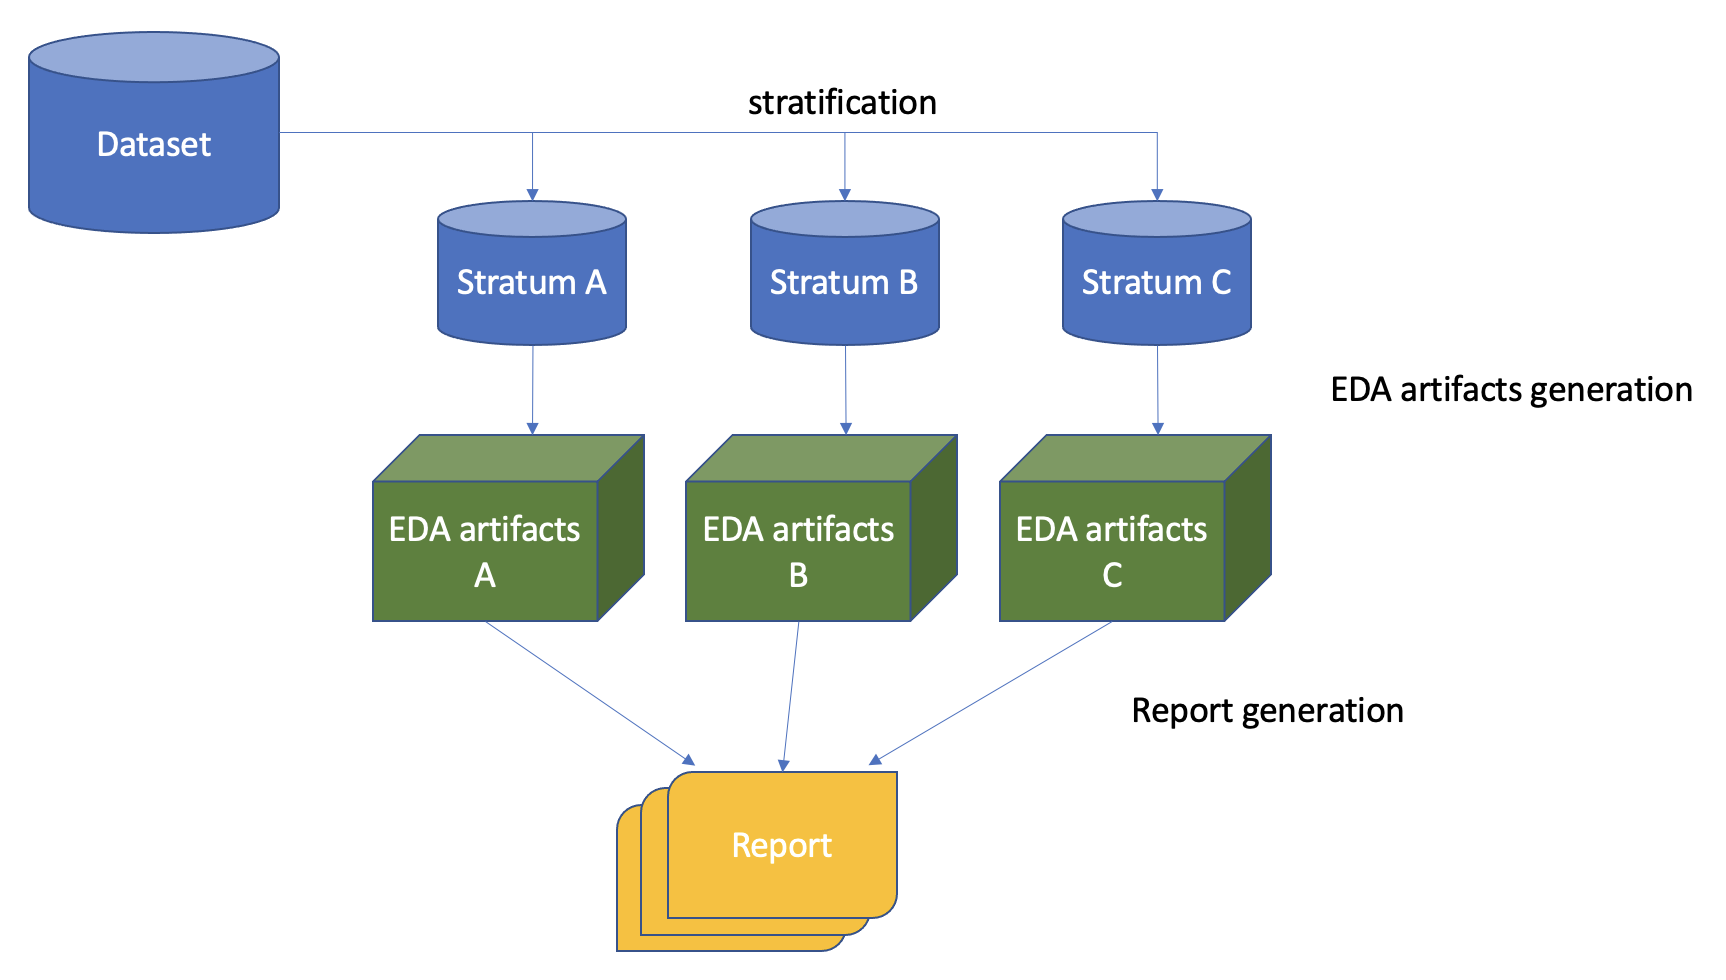
For the configuration file above LogML performs the following sequence of actions:
input dataset is stratified based on given configuration file
EDA artifacts are produced per each stratum
Result report is generated (includes EDA views for all strata)
High-level schema of EDA:
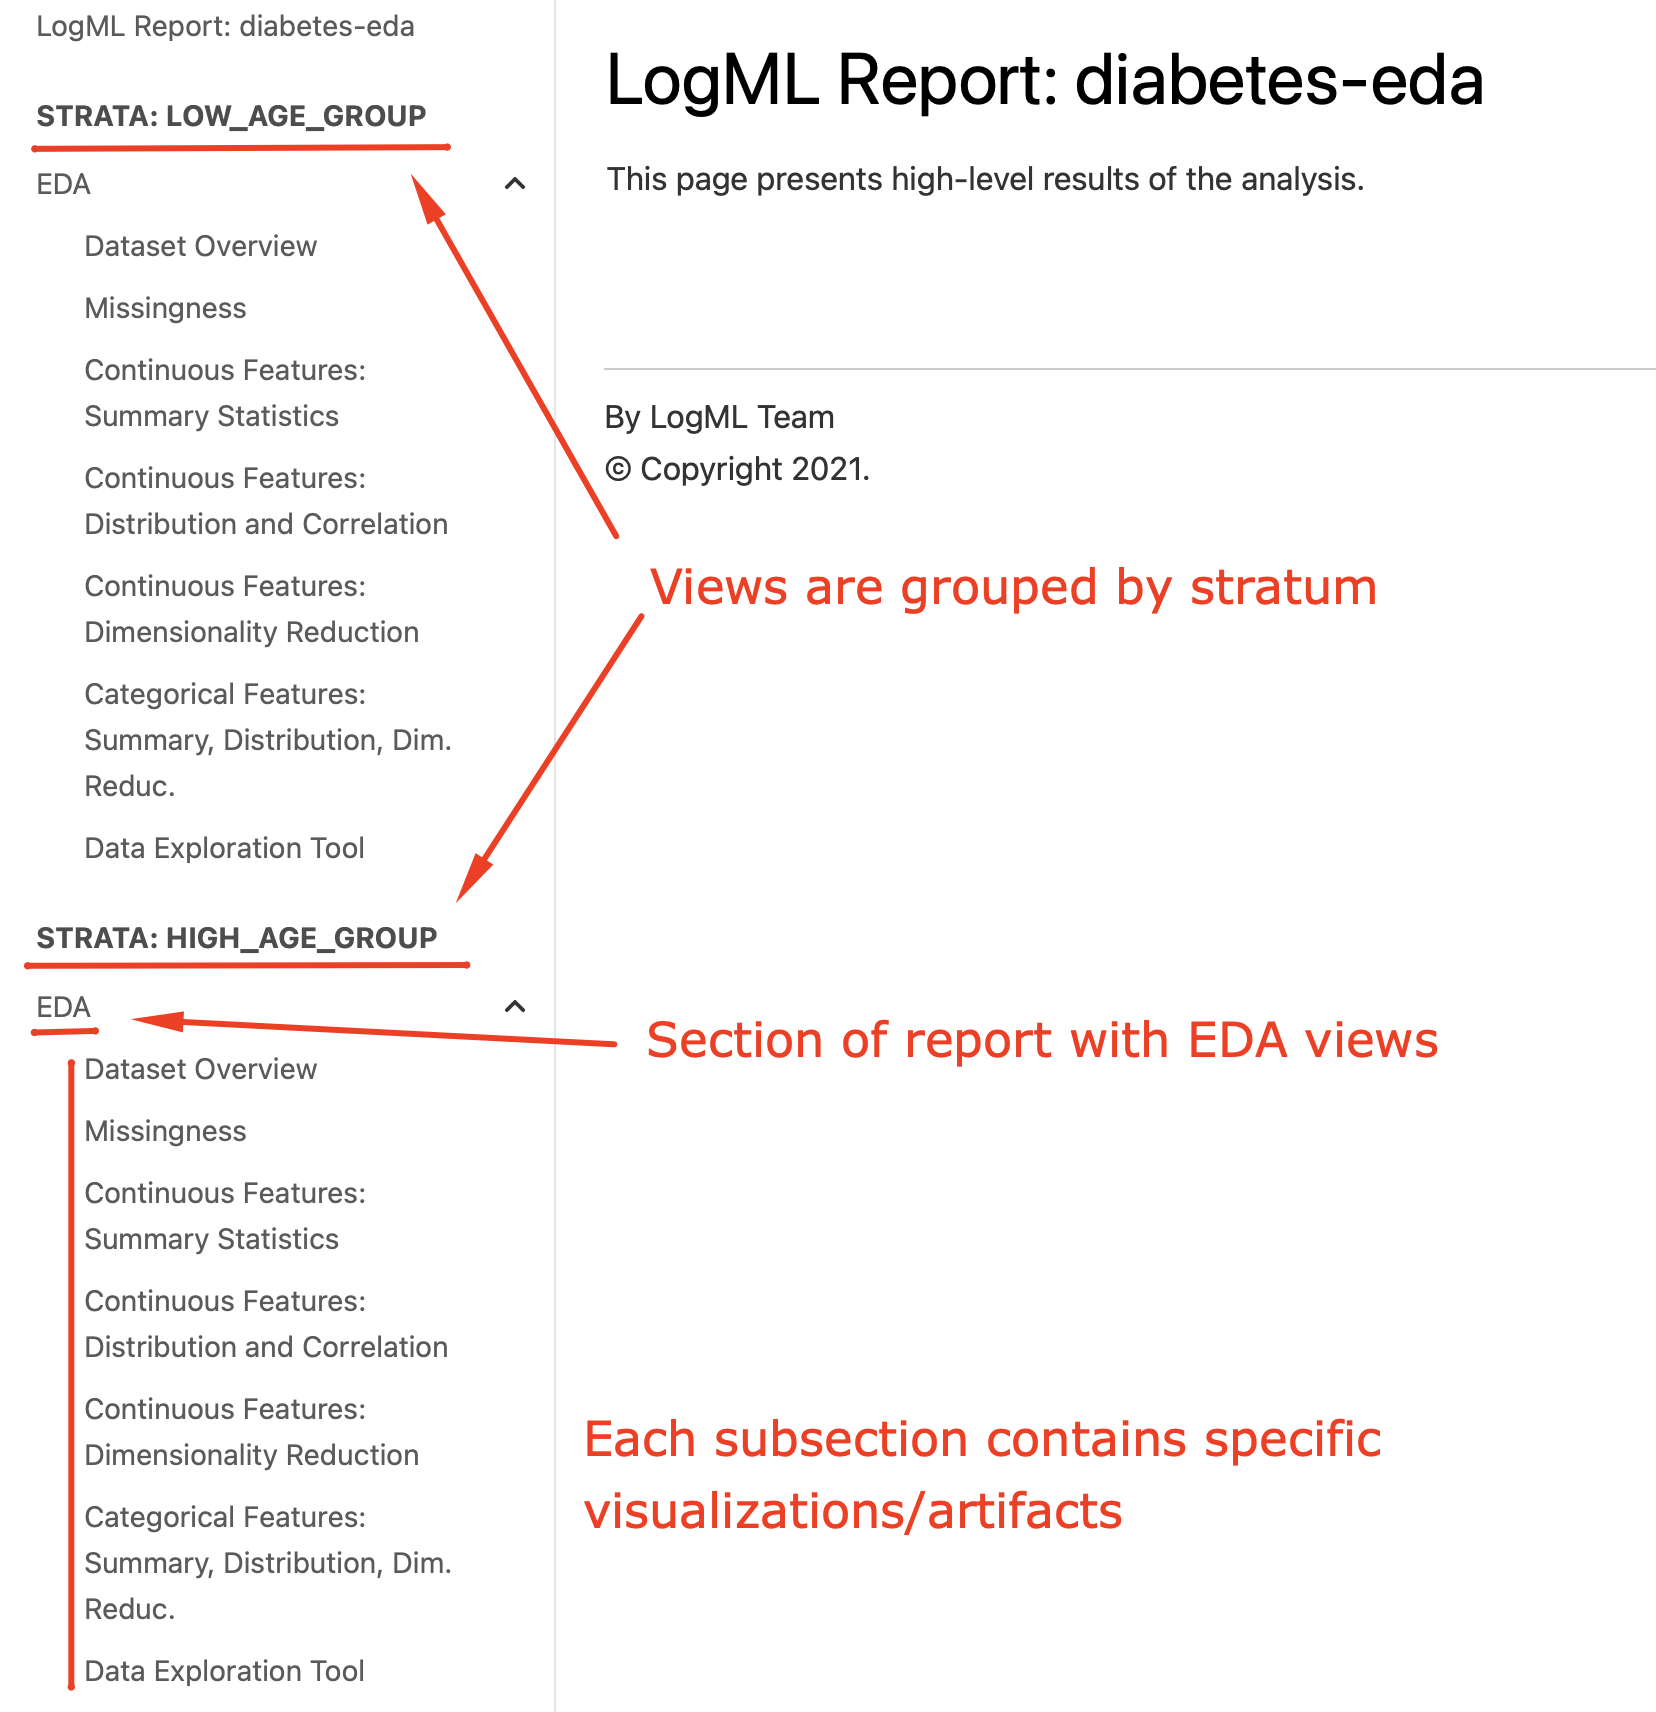
Structure of EDA report (diabetes):
Produced artifacts
As it was mentioned above LogML decouples artifacts generation and visualization processes. All required EDA artifacts are saved to be reused later (either by LogML or users, if needed).
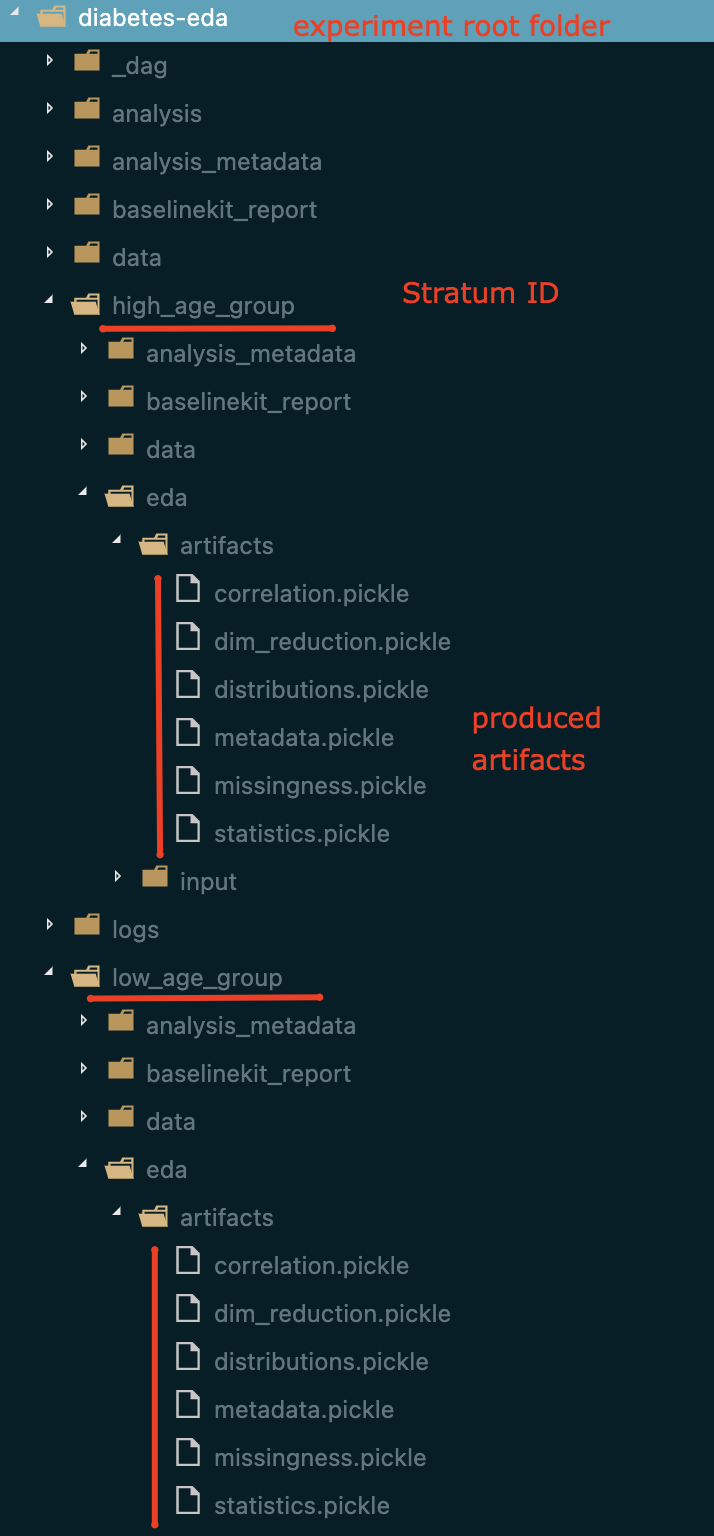
For each stratum EDA artifacts are saved within {run_name}/{stratum id}/eda/artifacts/ folder.
Example of how and where EDA artifacts are saved:
Metadata
logml.eda.artifacts.metadata.DatasetMetadata artifact provides a very basic metadata-like information:
list of numeric columns within dataset
list of categorical column within dataset
The artifact is utilized by while producing other EDA artifacts.
Correlation
logml.eda.artifacts.correlation.CorrelationSummary artifact contains the following information:
correlation matrix that was produced using a given EDA parameters. For visualization purposes linkage matrix is kept as well (to order dataset columns by correlation similarity).
correlation groups information (please see the details here: correlation_groups_overview).
Missingness
logml.eda.artifacts.missingness.MissingnessSummary artifact contains the following information:
missing values summaries (per rows/columns)
complete datasets for numerical/categorical columns. For a given number of columns - N, ‘complete dataset’ can be defined as a subset of N columns and maximal number of rows so that there are no NaN values within the sub-dataset.
matrix of pairwise NaN distances (how missingness patterns across rows are similar)
Statistics
logml.eda.artifacts.stats_summary.StatisticsSummary artifact contains the following information for
numerical columns:
basic statistics (mean, std, min, max, 25%/50%/75% percentiles)
custom statistics (# unique, skewness, kurtosis, corrected coefficient of variation (std/mean))
distribution fitness statistics (normality / log-normality via Shapiro-Wilks test)
Dimensionality reduction
logml.eda.artifacts.dimensionality_reduction.DimensionalityReduction artifact contains
the following information:
Distributions
logml.eda.artifacts.distributions.DistributionsSummary artifact contains
the following information:
histograms for numerical features so that user could visually assess how distributions across features differ and apply appropriate transformations if needed (log1p, for example)
Report structure
Let’s take a look at available EDA views and what visualizations those do include.
Dataset Overview
Introductory section that helps to briefly take a look at the given dataset.
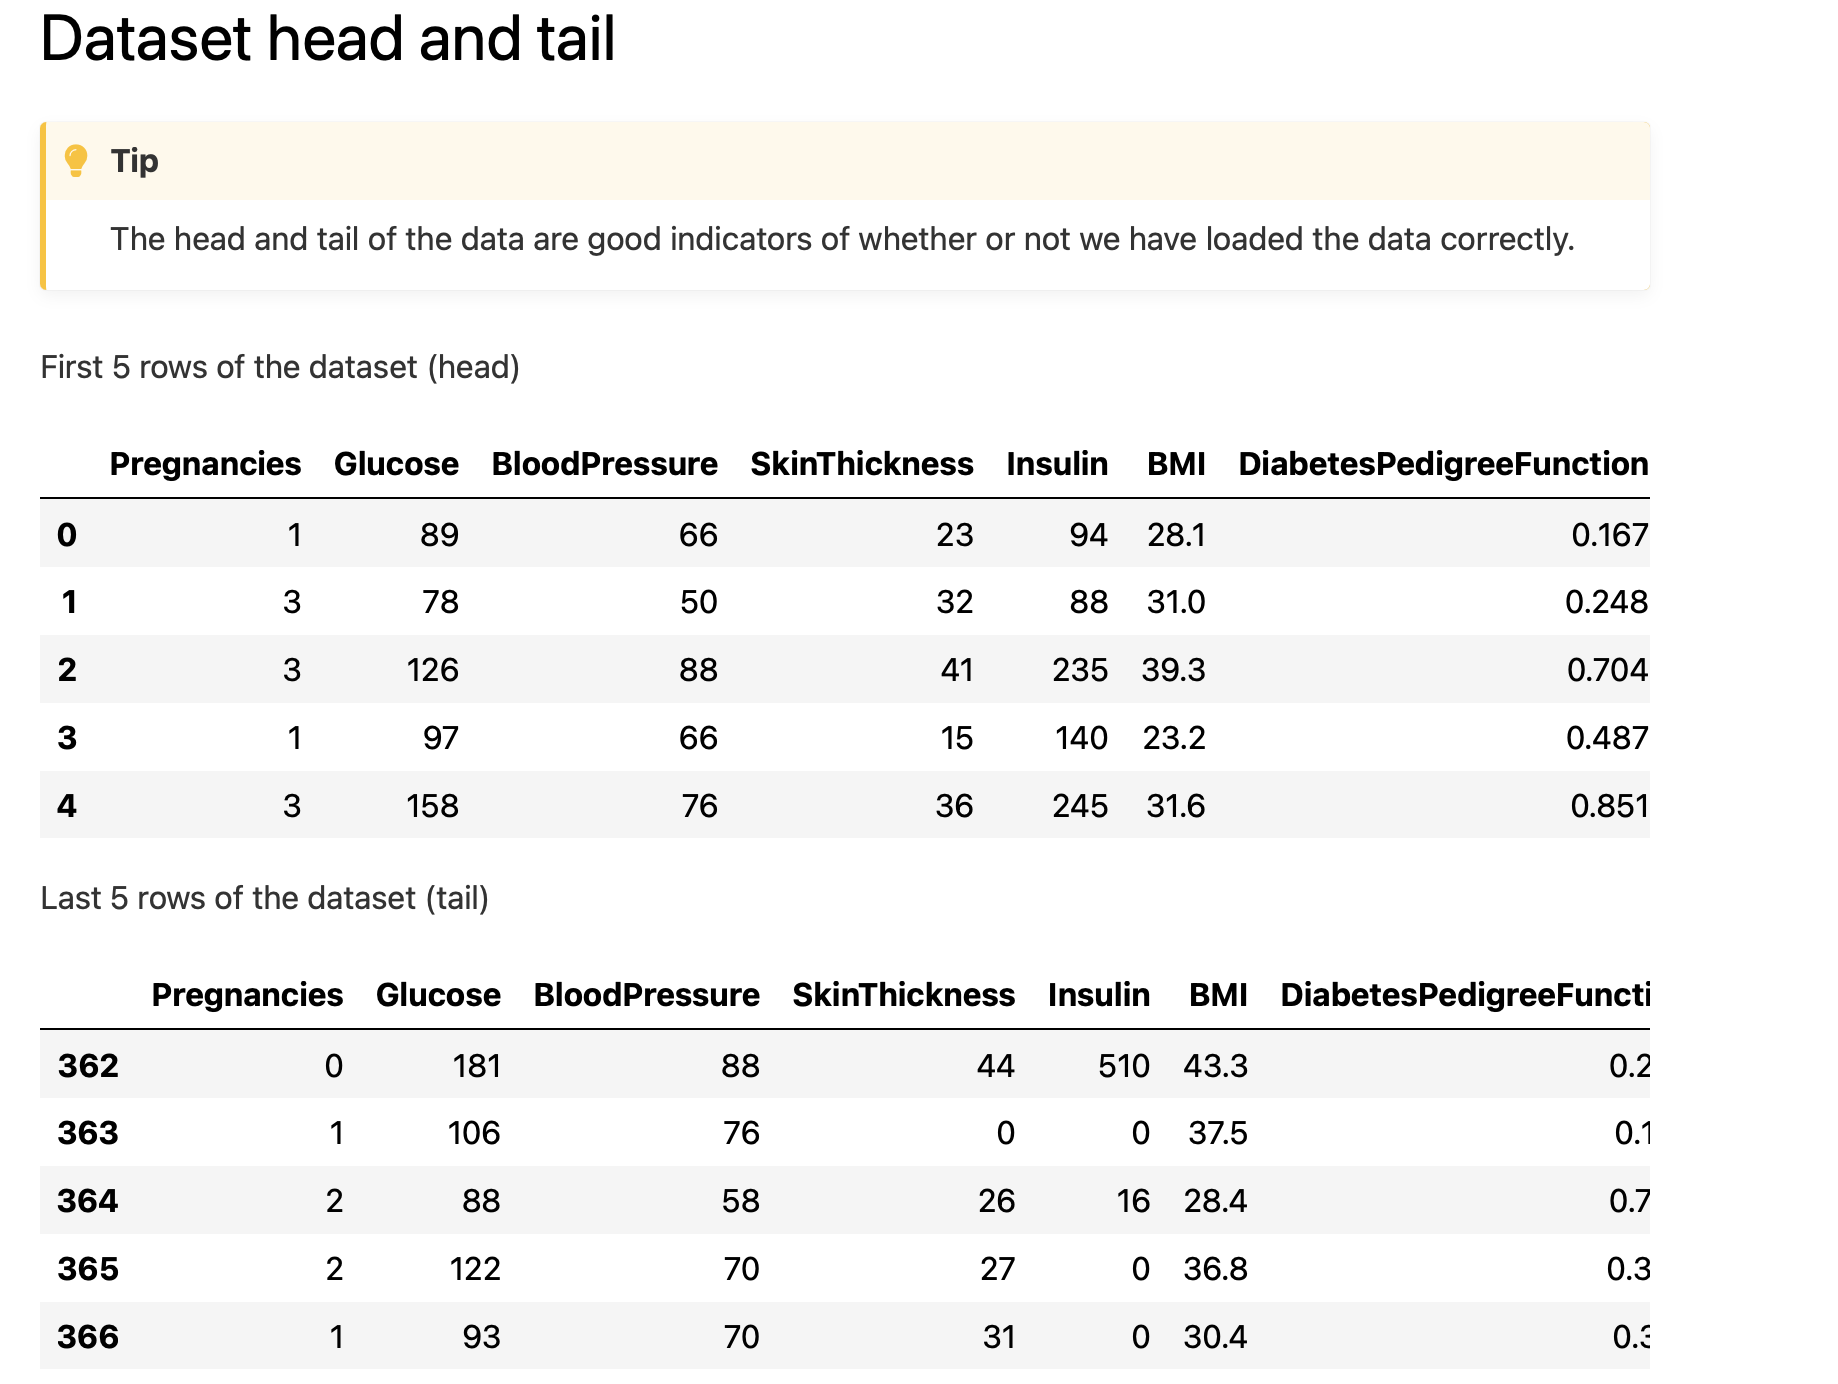
Dataset head/tail - helps to check whether dataset’s schema is fine:
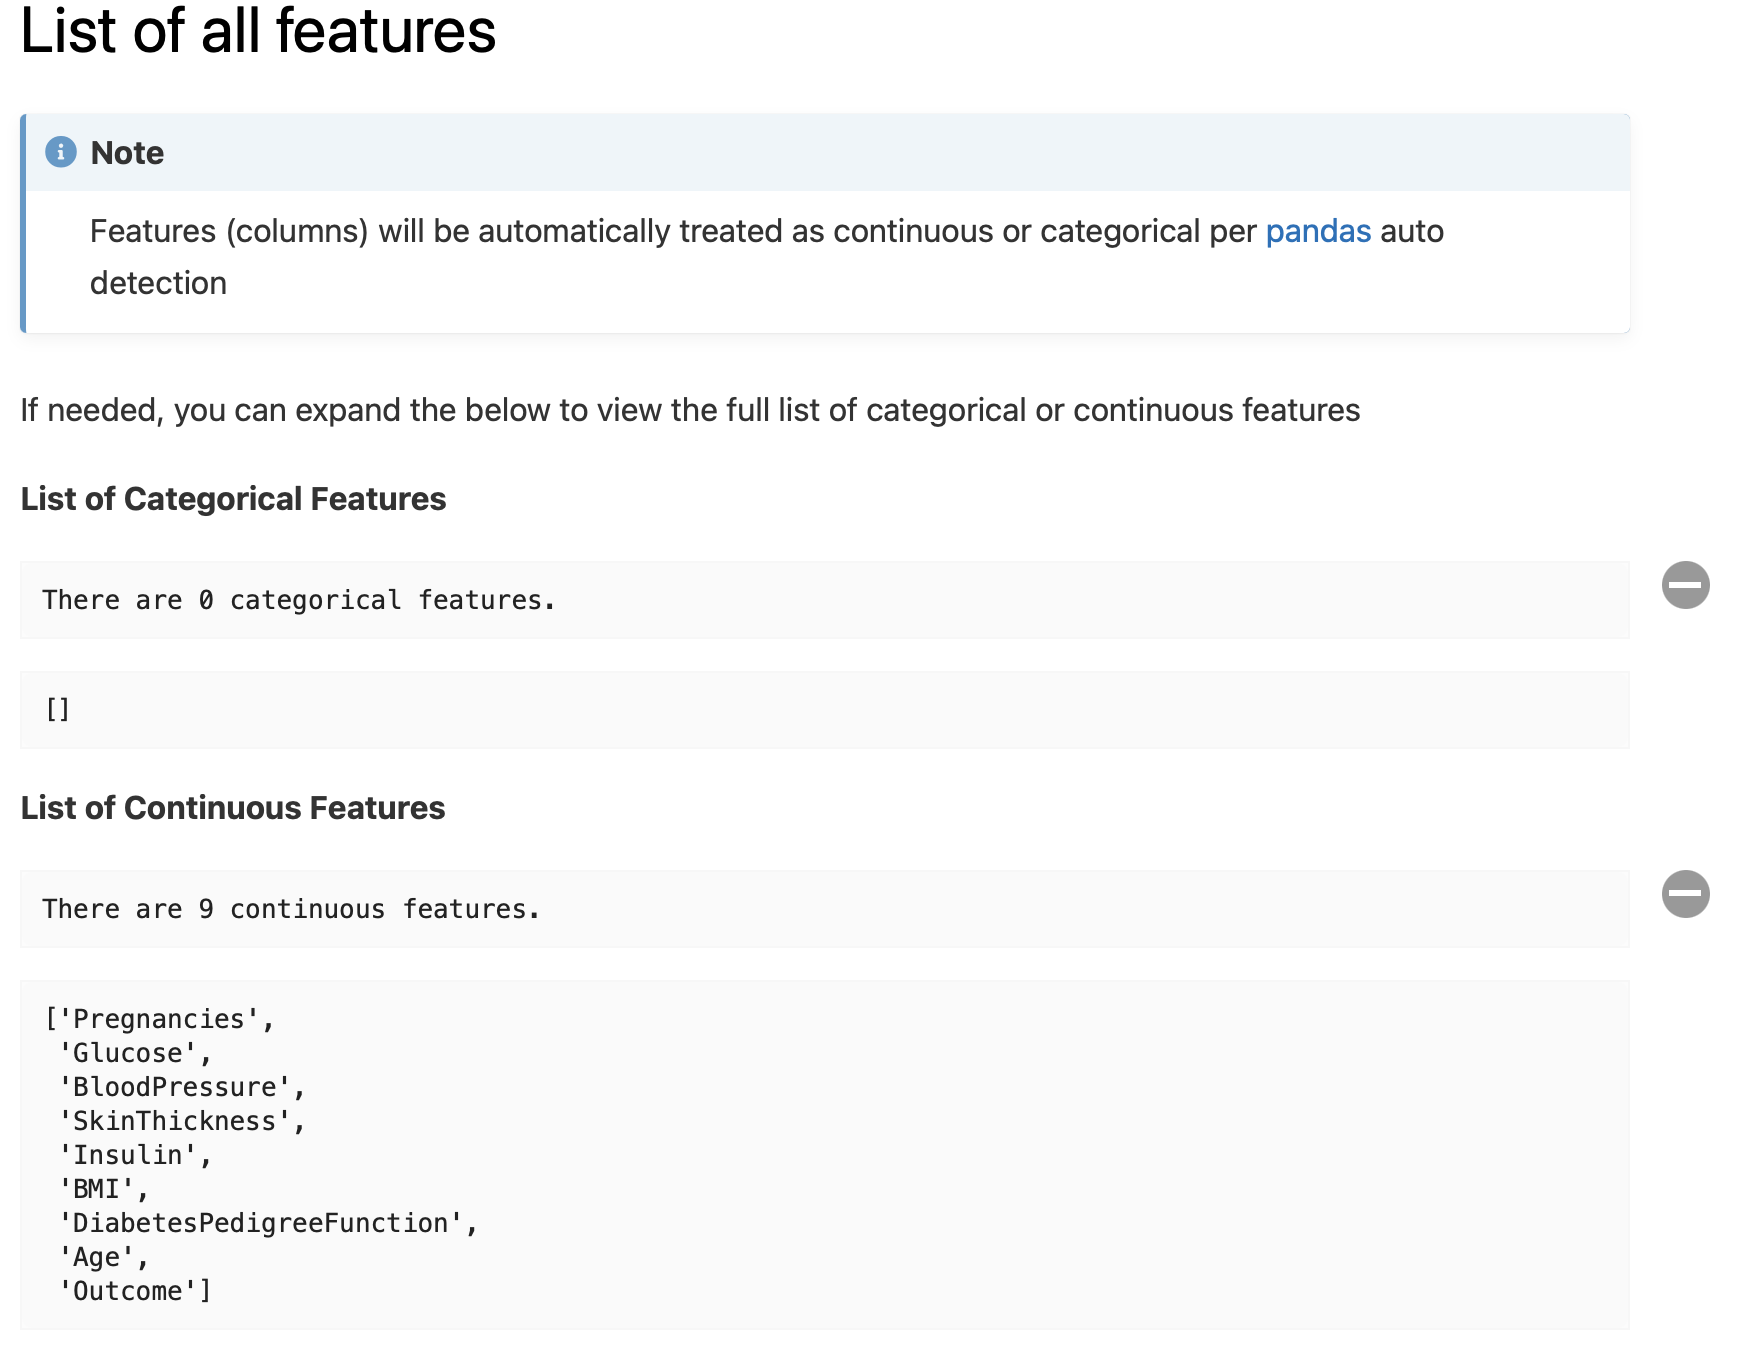
Lists of numerical and categorical features - to confirm user’s assumptions if any, and explicitly ‘define’ those lists:
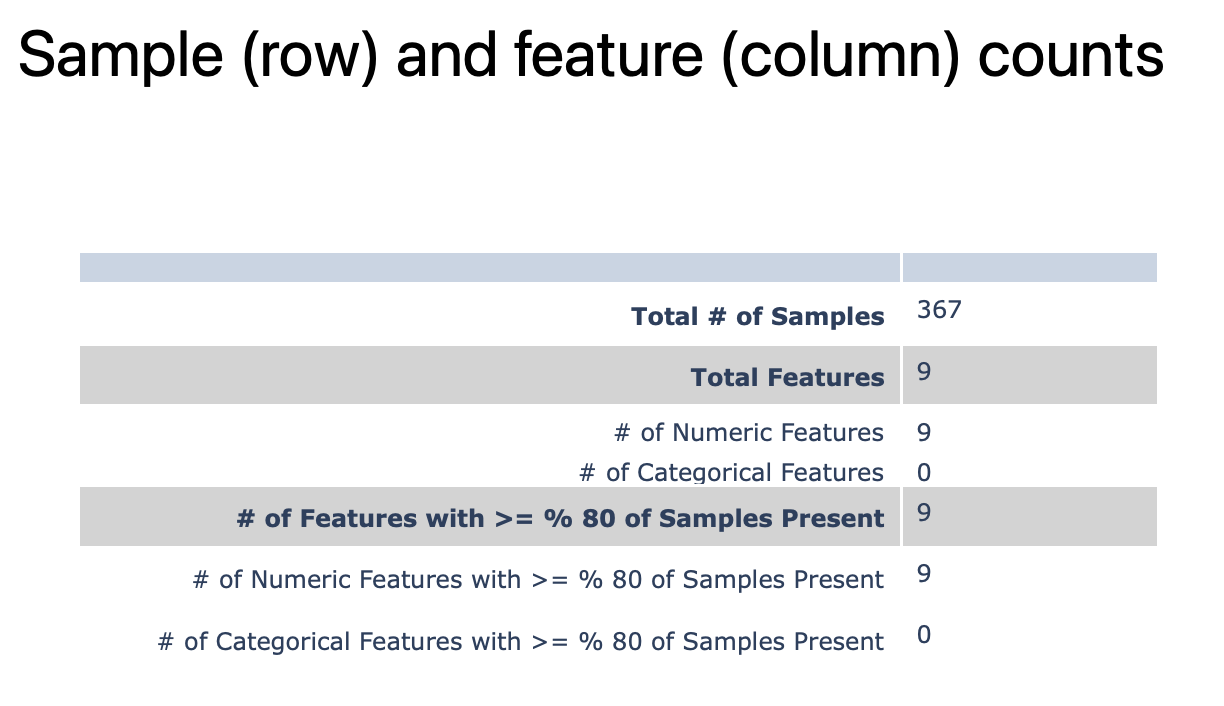
Basic dataset statistics:
Missingness
TODO
Continuous Features: Summary Statistics
Section with different statistics for numerical features.
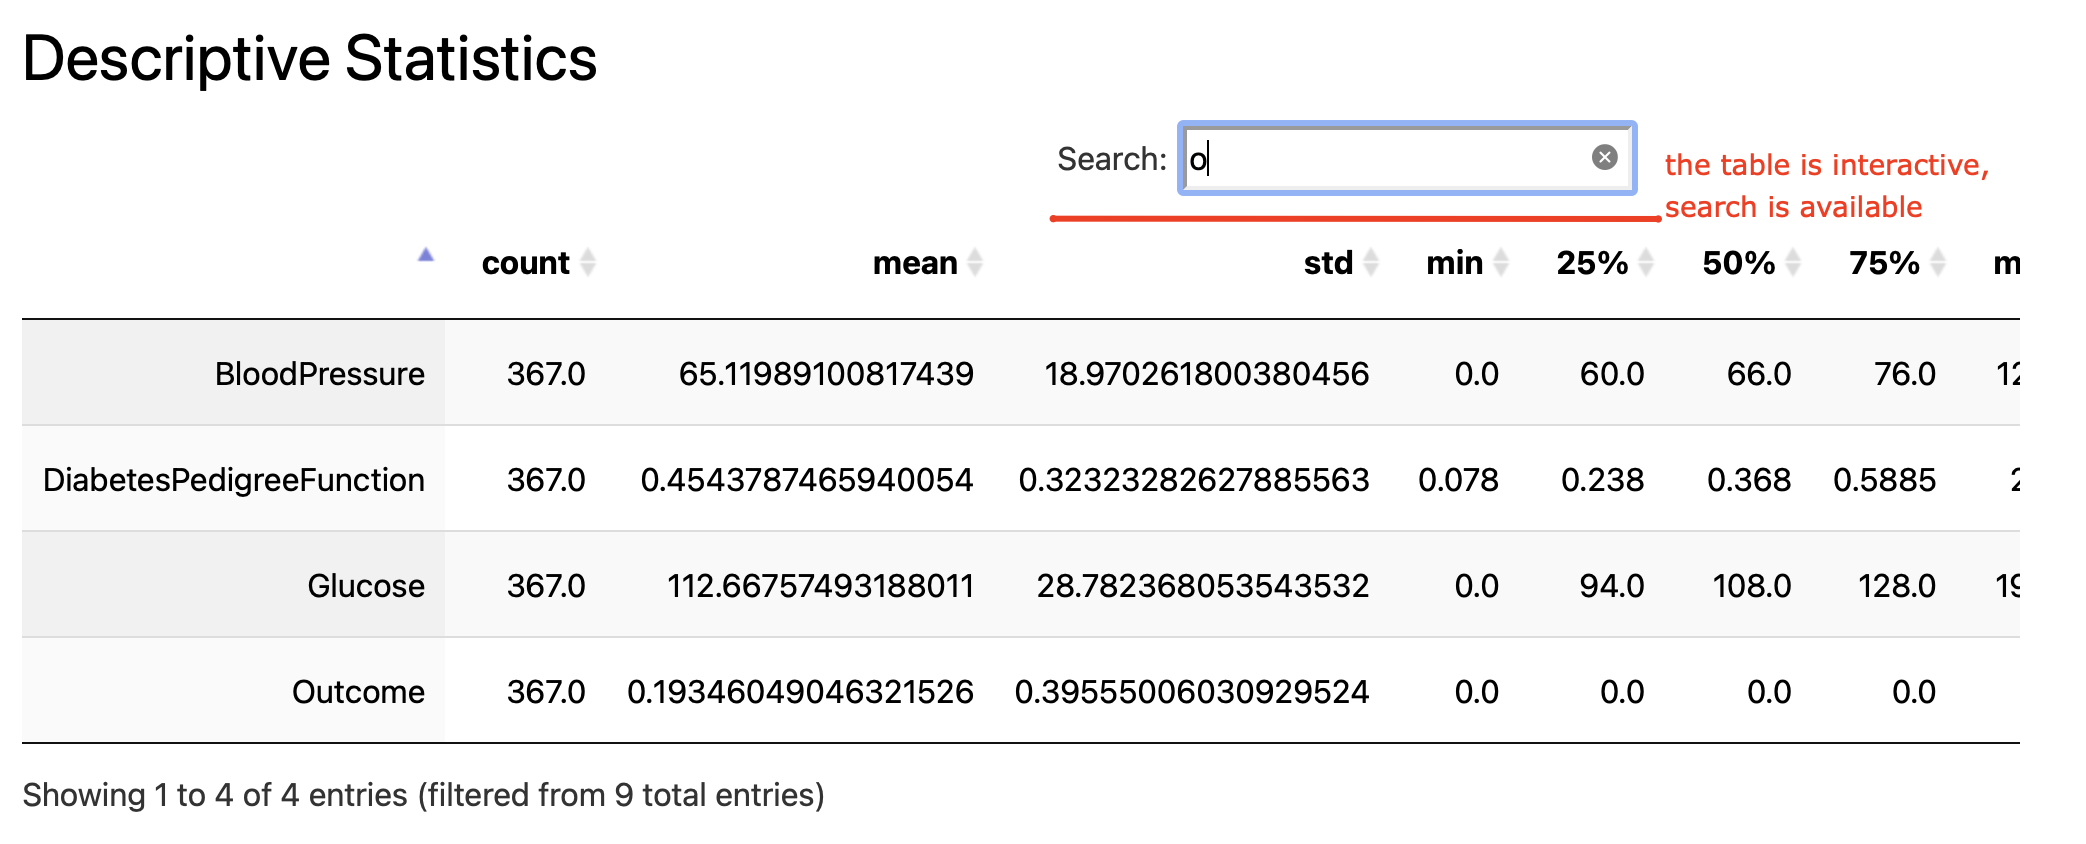
Interactive table with descriptive statistics:
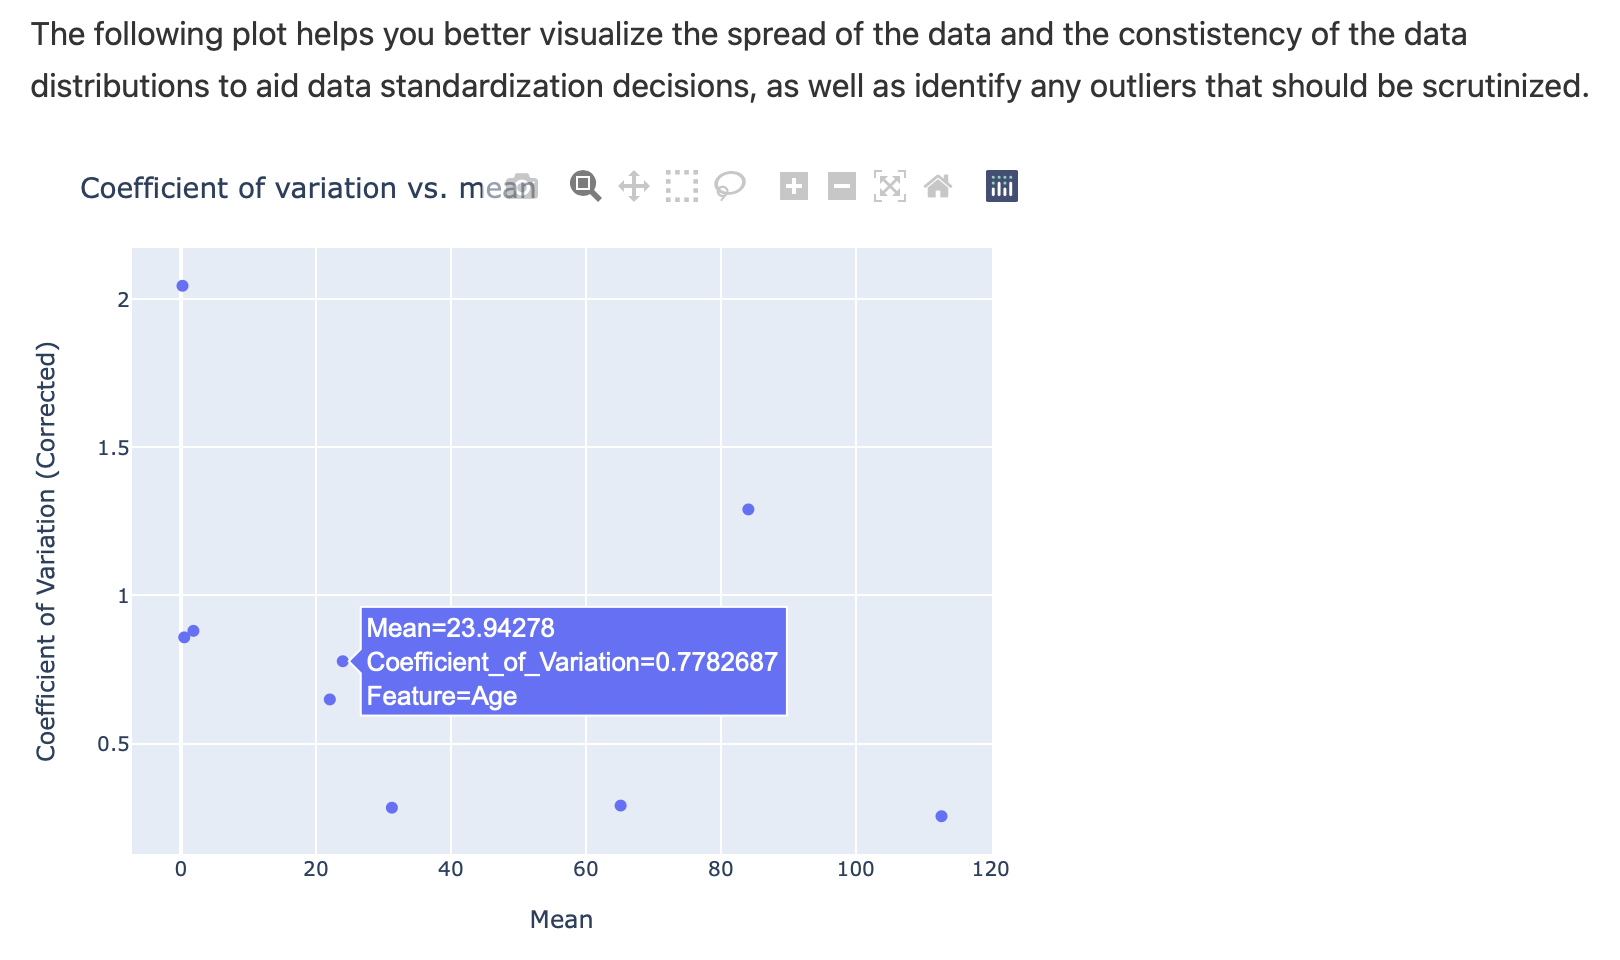
Interactive plot to assess coefficient of variation across features:
Continuous Features: Distribution and Correlation
Section helps to understand feature distribution shapes and how features correlate.
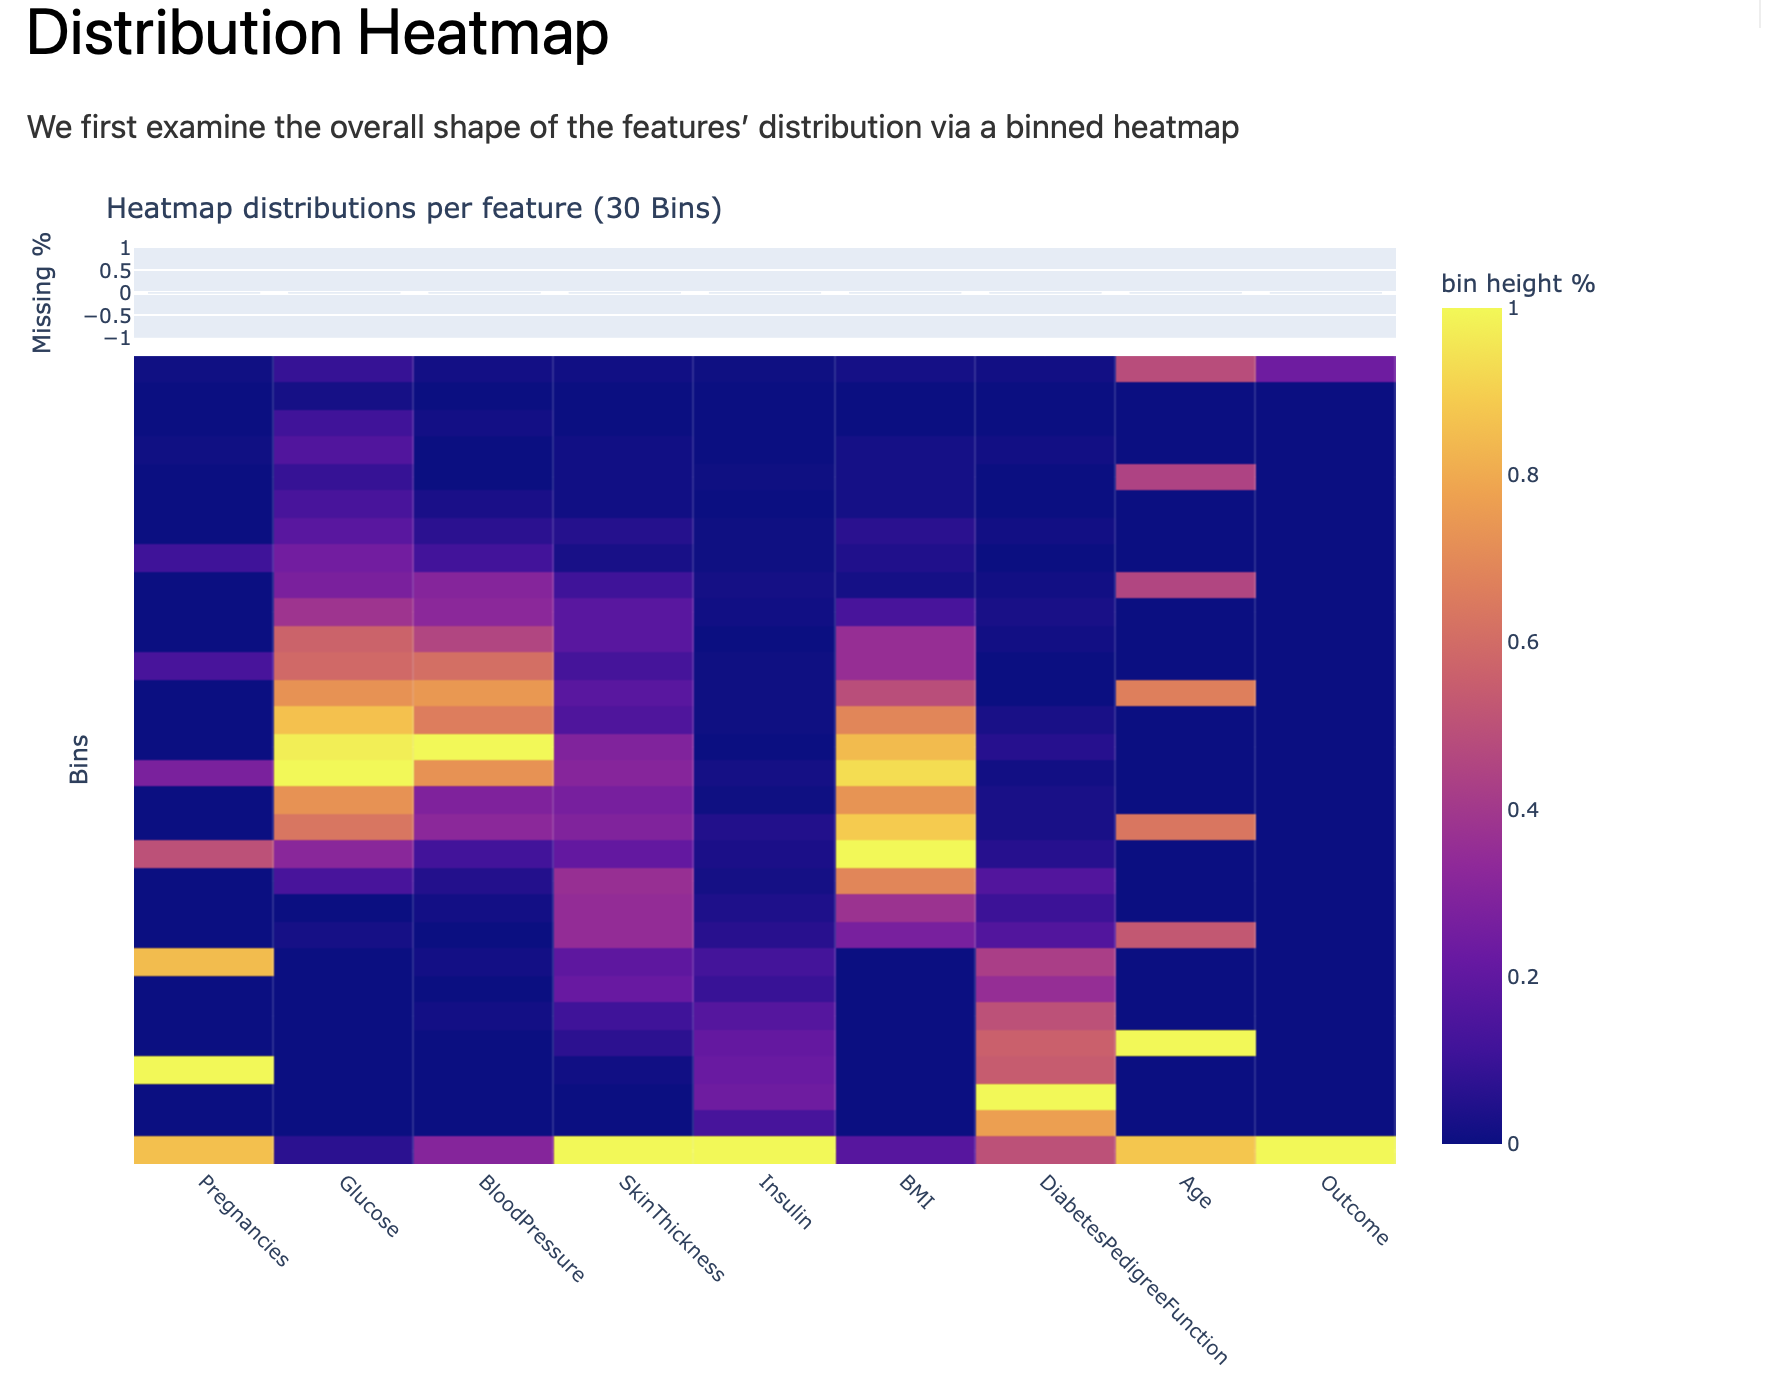
Feature distribution are showed in form of heatmap - categorical features could be captured, outliers, etc.:
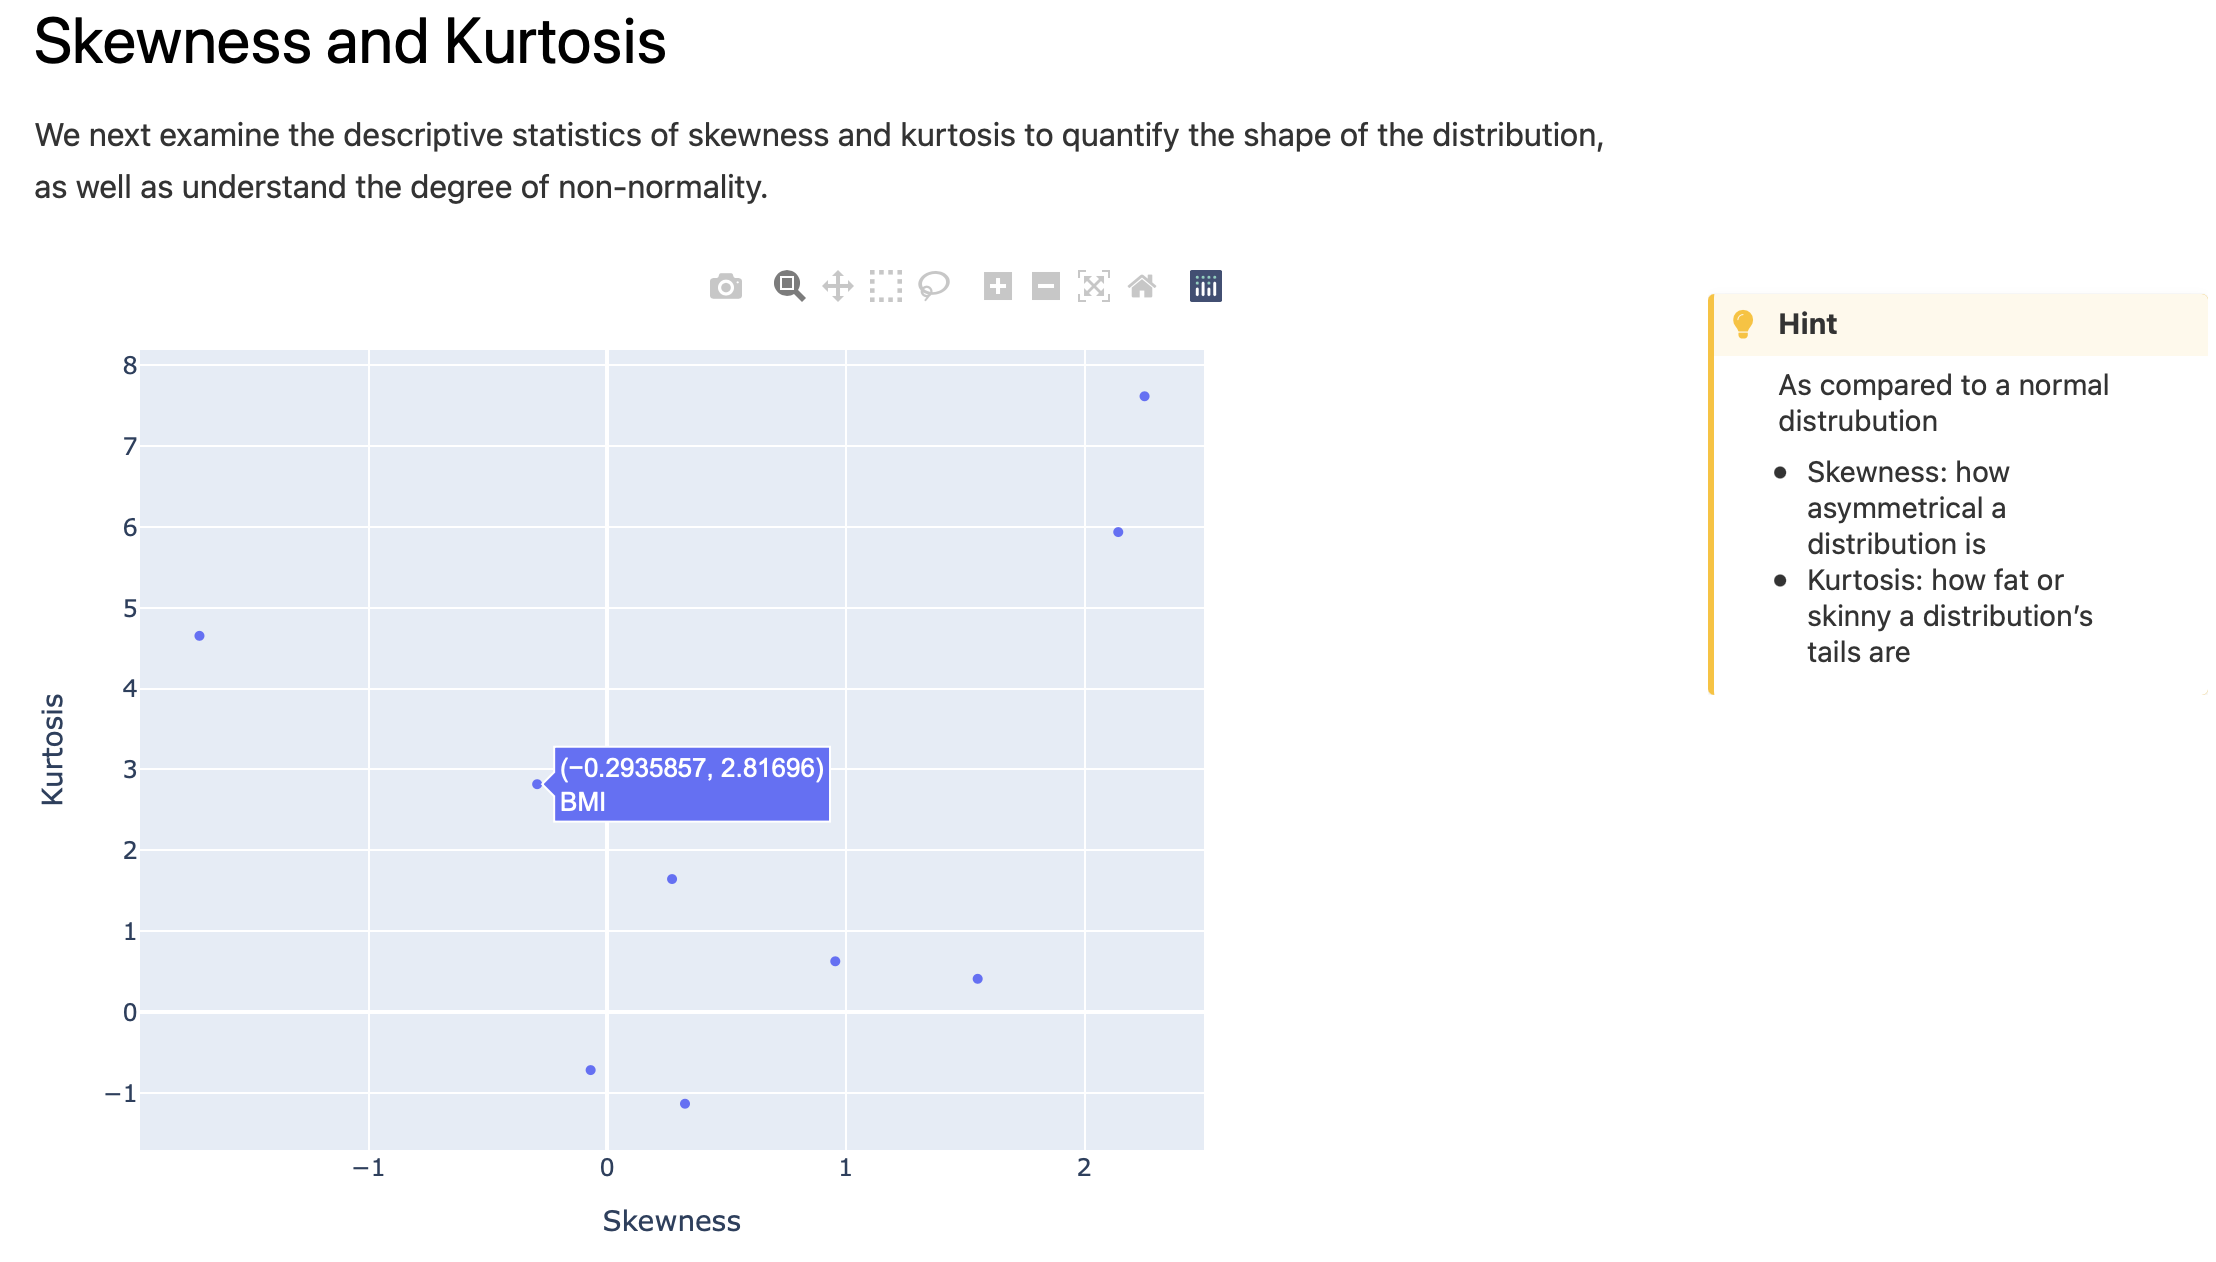
Interactive plot for assessment of features skewness and kurtosis:
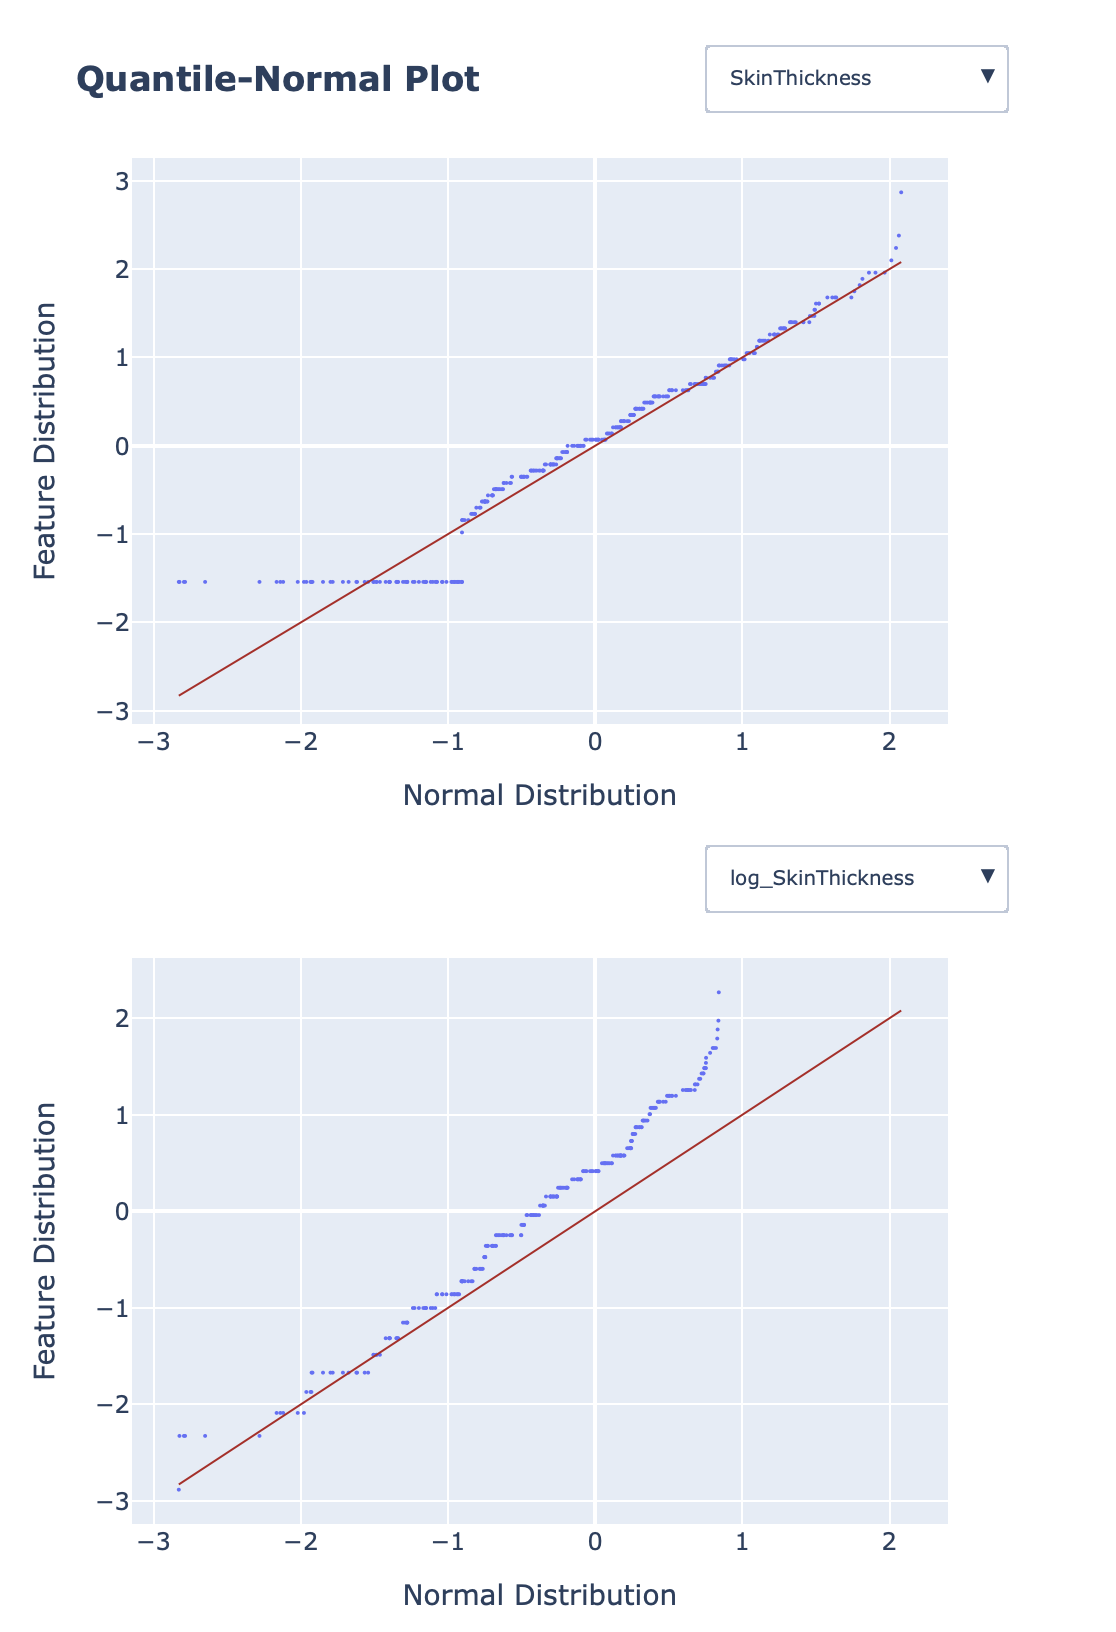
Quantile-normal plots for comparing features distributions and checking whether features have normal distribution:
Searchable table with most correlated pairs of features:

Correlation matrix heatmap:

Correlation matrix dendrogram (to assess groups of similar features - correlation similarity):
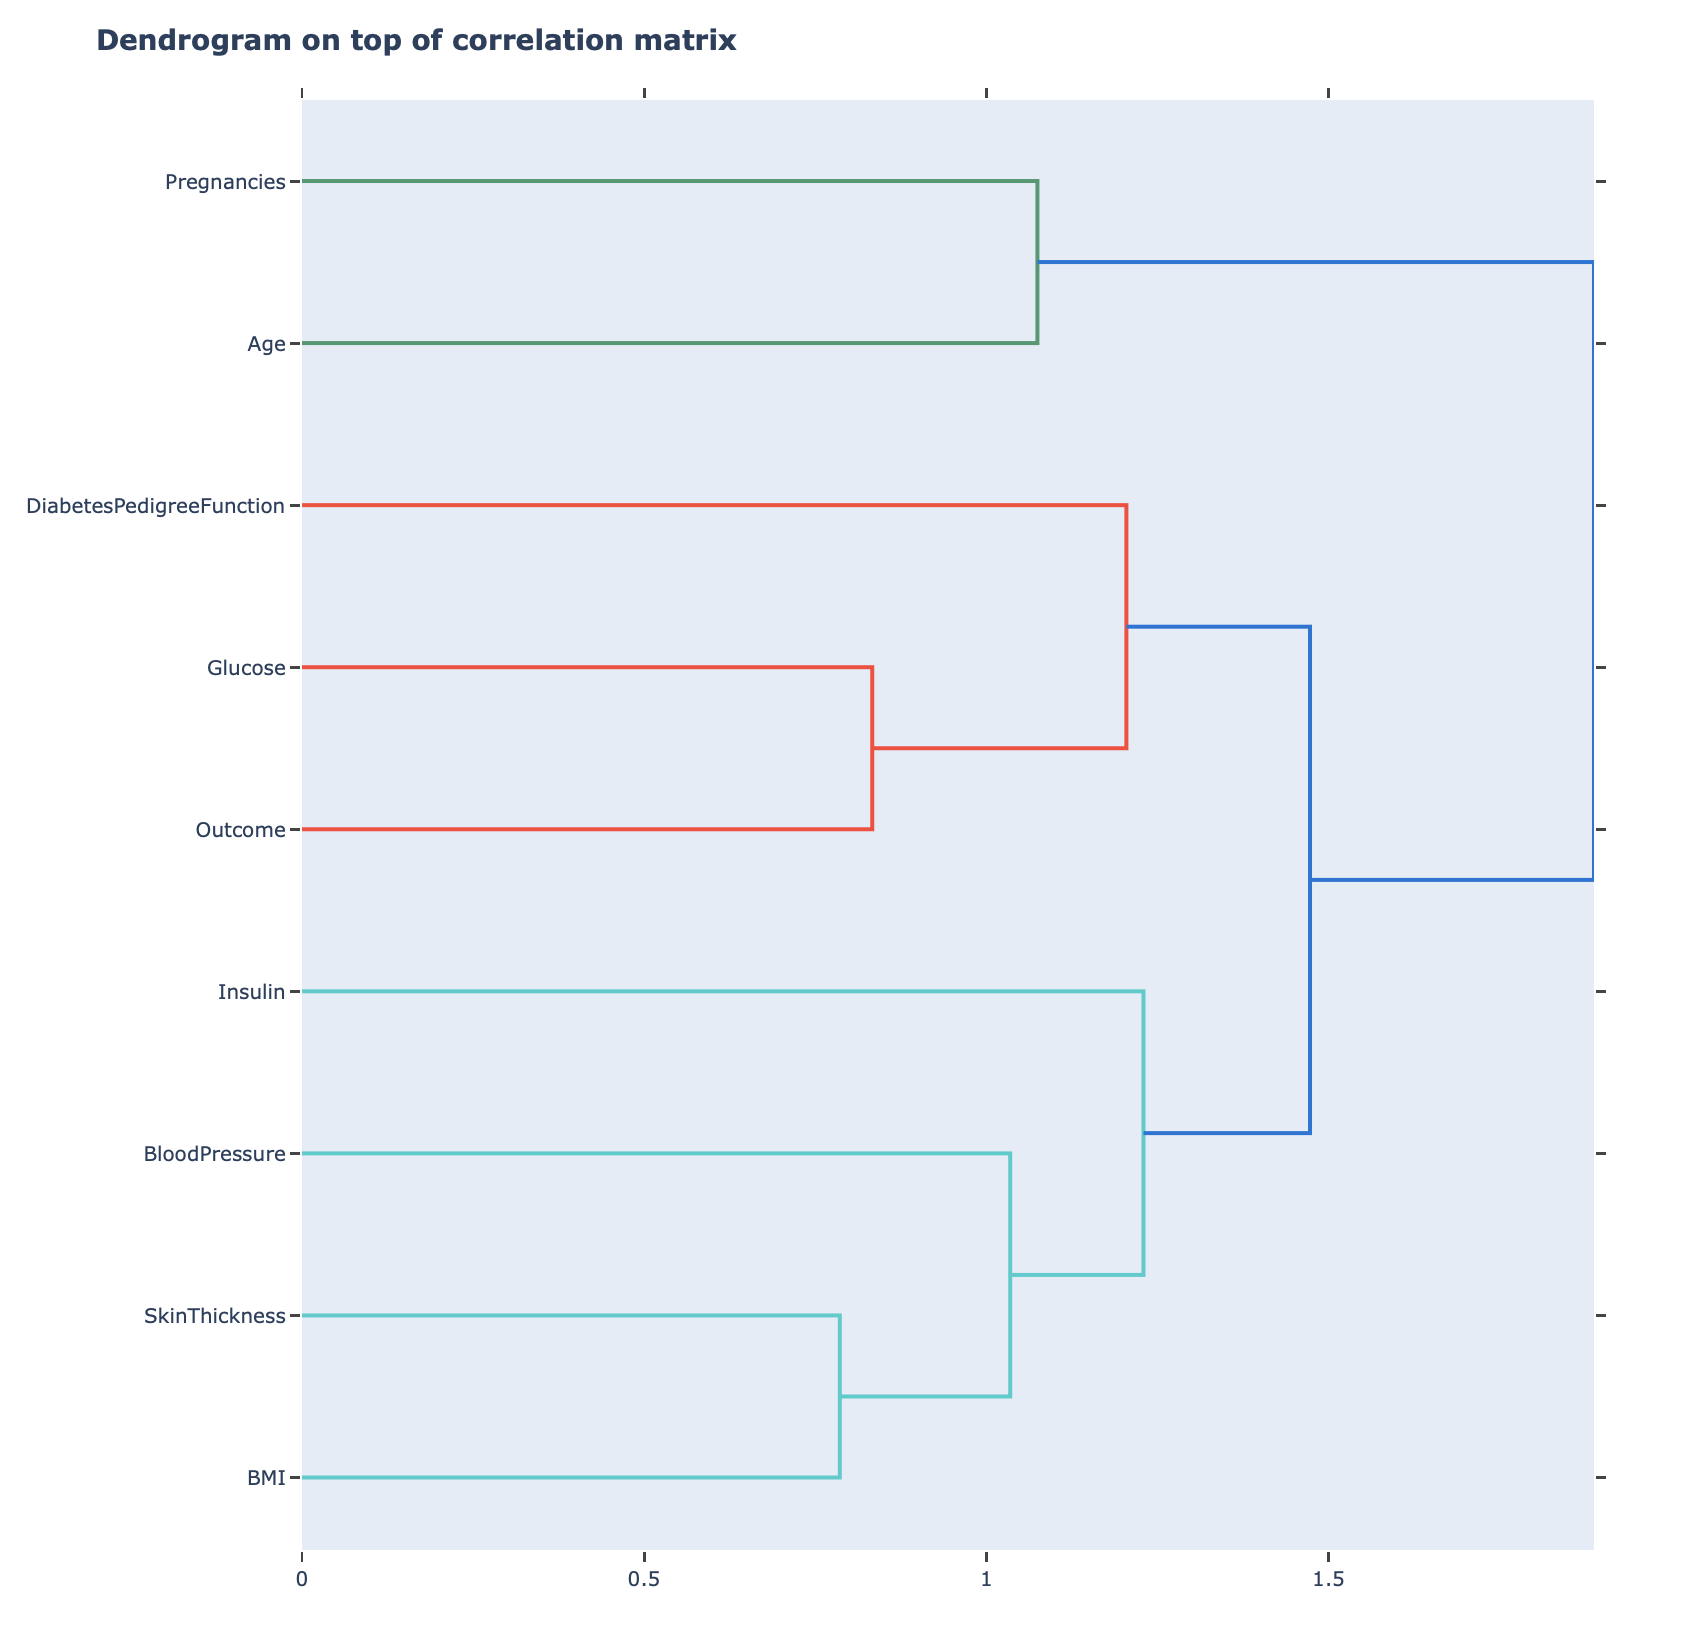
Correlation groups overview (please see the details here: correlation_groups_overview)
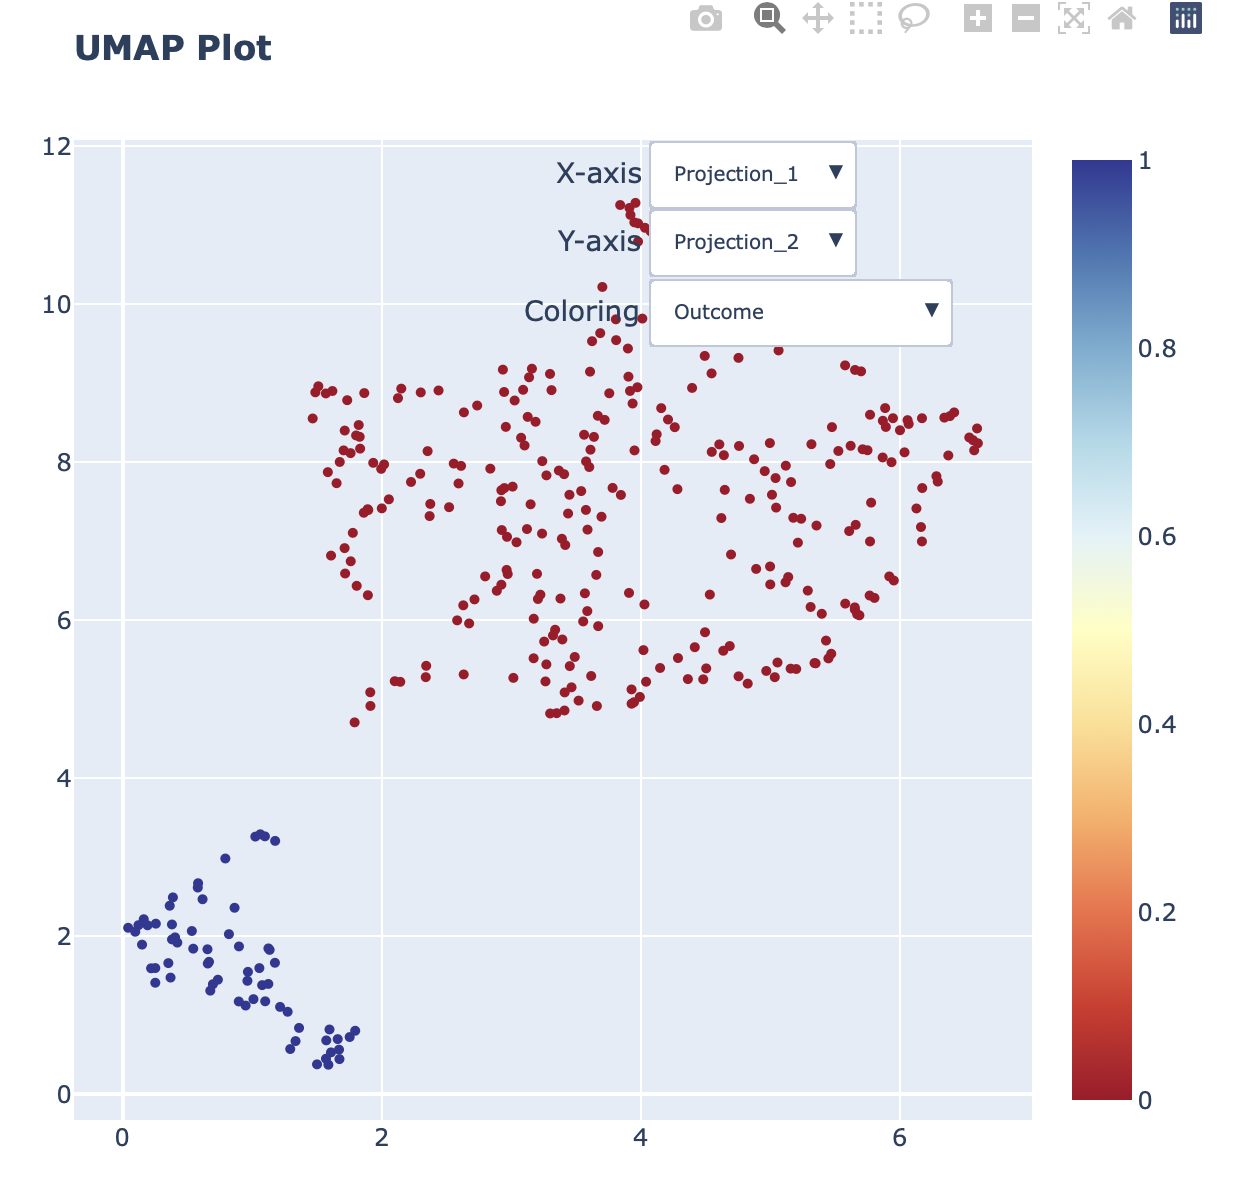
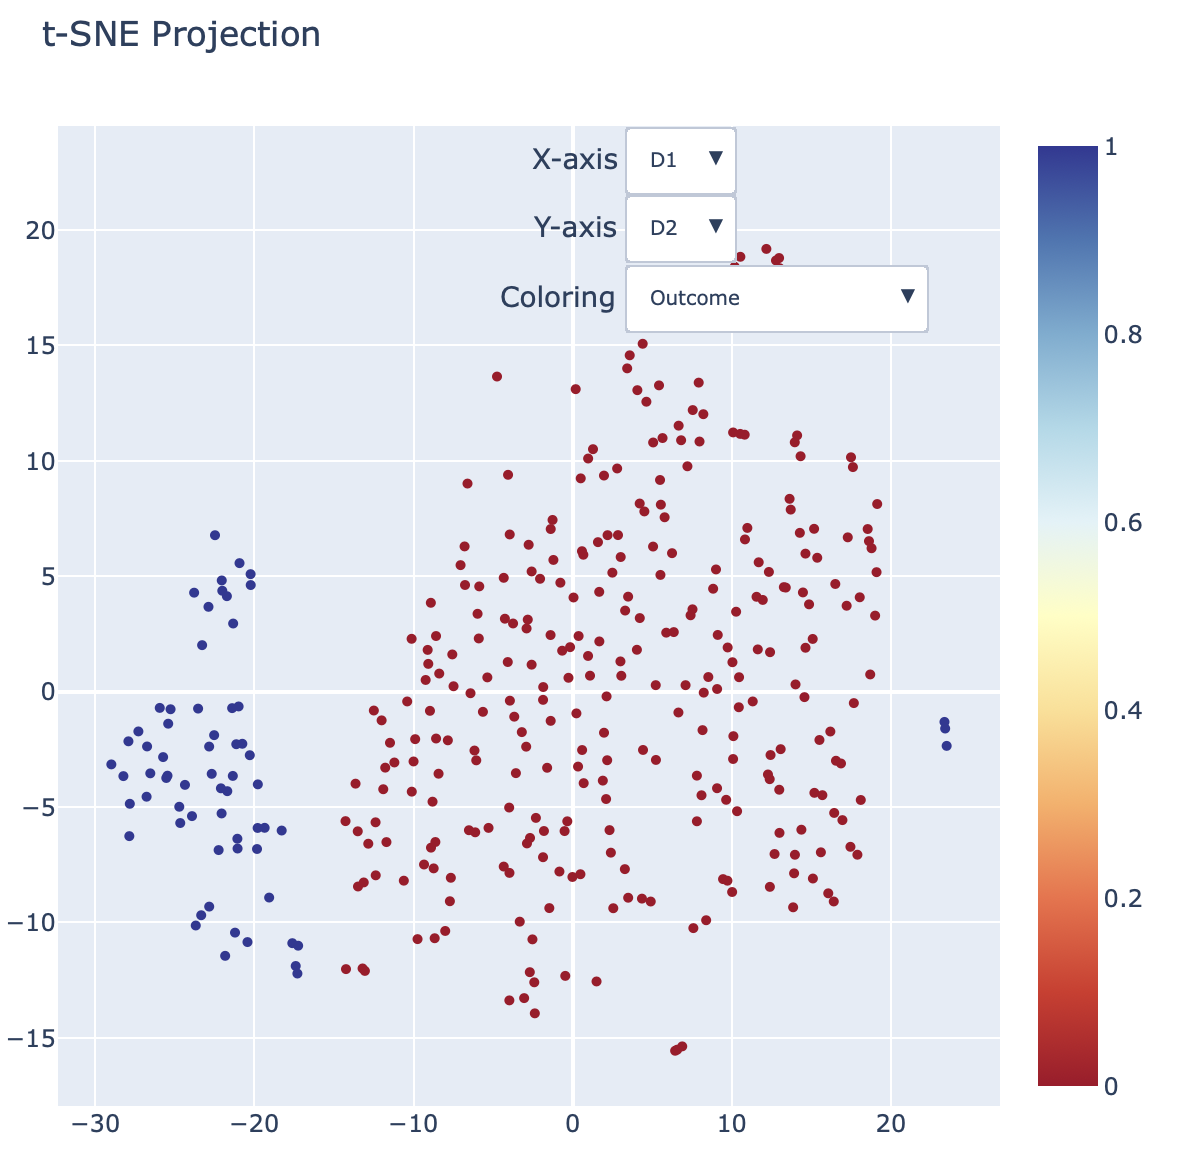
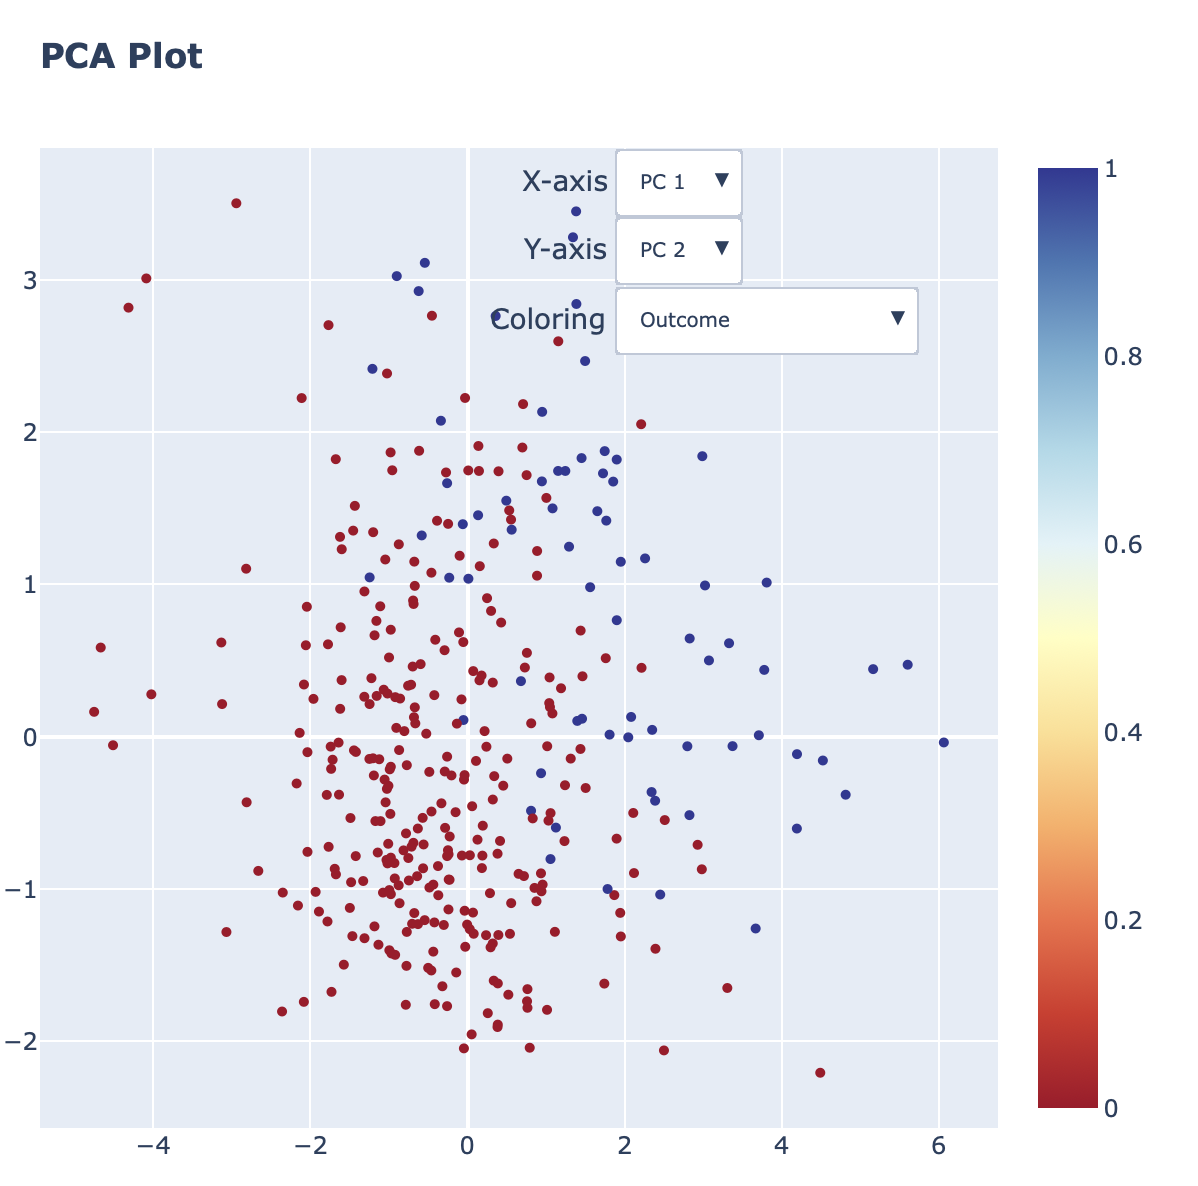
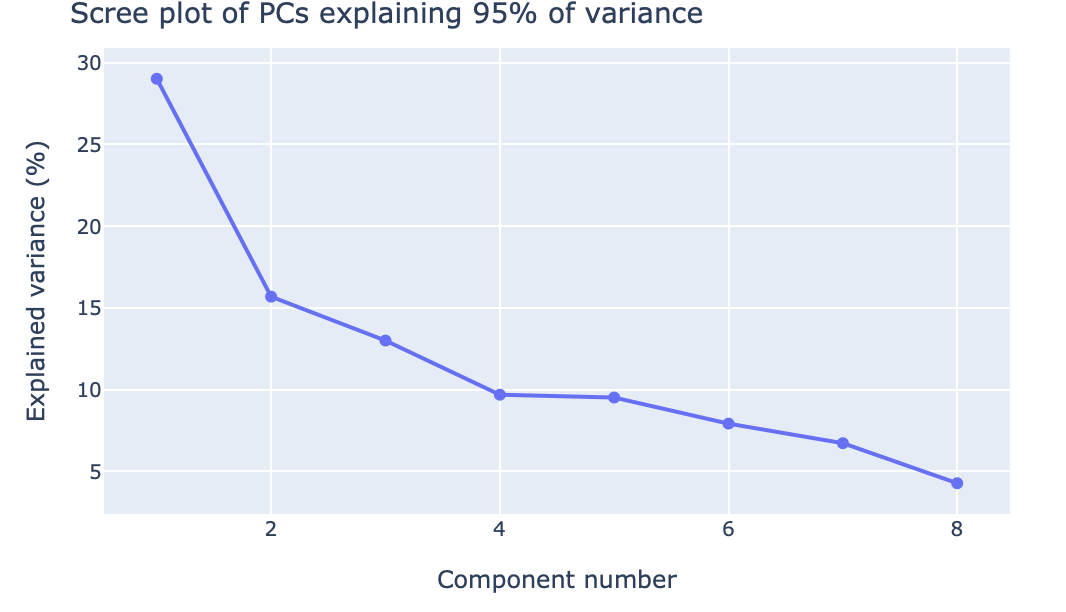
Continuous Features: Dimensionality Reduction
Section helps to understand whether small number of descriptive dimensions could reveal any latent patterns of interest.
Interactive UMAP plot
Interactive t-SNE plot
Interactive PCA plot
Scree plot of PCA components
Categorical Features: Summary, Distribution, Dim. Reduc.
TODO
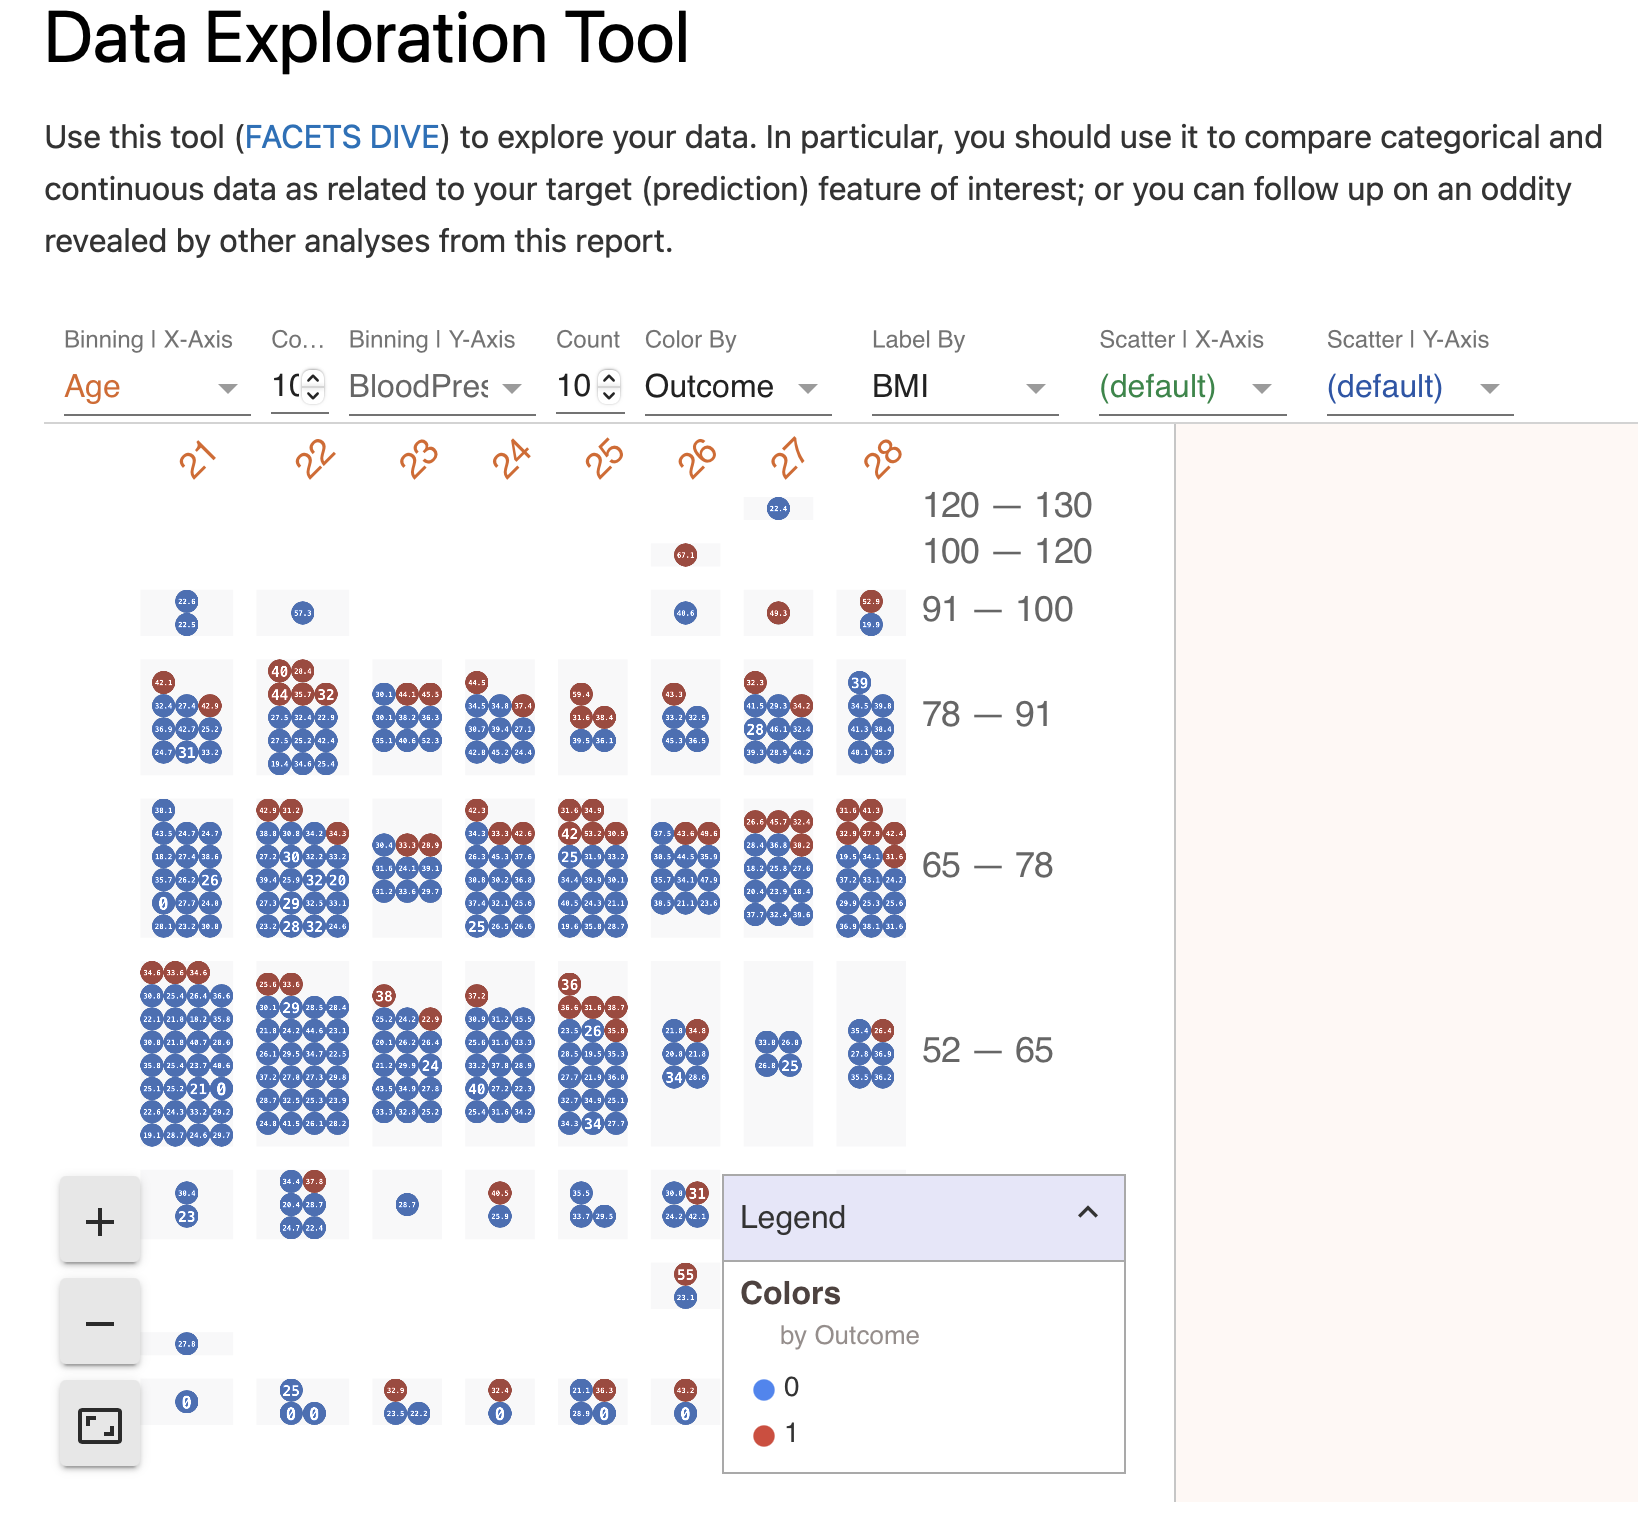
Data Exploration Tool
Section provides assess to FACETS DIVE tool for in-browser data manipulation.