Data Preprocessing
Data preprocessing step transforms input (raw) data so that is becomes suitable for machine learning models. Basic data transformations usually are:
removing or imputing missing values.
encoding non-numerical/categorical variables
normalizing numeric data
DatasetPreprocessingSection section provides a way to define data transformations of
interest (the full list of available data transformations
is available here: Data Transformers).
Preprocessing preset
By default LogML provides predefined sequence of data preprocessing steps.
Their details can be configured by
DatasetPreprocessingPresetSection section):
 1...
 2
 3dataset_preprocessing:
 4    preset:
 5      enable:                True
 6      features_list:
 7        - .*
 8      remove_correlated_features: true
 9      nans_per_row_fraction_threshold: 0.9
10      nans_fraction_threshold: 0.7
11      apply_log1p_to_target: false
12      drop_datetime_columns: true
13
14...
Preprocessing preset includes the following steps:
Select only needed columns (
features_list).Drop columns of date/time data type.
Drop rows where
targetvalues are missing.Drop rows, where fraction of missing features values is greater or equal to
nans_per_row_fraction_thresholdparameter (by default 90%).Drop columns, where fraction of missing features values is greater or equal to
nans_fraction_thresholdparameter (by default 70%).Numeric features:
Apply standardization to numeric features.
Apply MICE imputer for numeric columns.
Categorical features:
For categorical columns impute using ‘most frequent’ strategy.
Apply one-hot-encoding for categorical features.
If
remove_correlated_featuresflag is True, correlation groups detection and removal of correlated features is applied. For details see Correlation Groups Detection.Target transformation:
If target column is numeric, and
apply_log1p_to_targetfield is set, thenlog1ptransformation is applied to the tartet column.If target column is categorical,
label_encodingtransformation is applied.
Explicit preprocessing
Let’s take a look at the following sample data preprocessing configuration for survival analysis modeling:
 1...
 2
 3dataset_preprocessing:
 4    enable:                     True
 5    # Target list of transformations.
 6    steps:
 7        # Each step consists of the following parameters:
 8        #  - 'transformer' - alias for transformation
 9        #  - 'params' - optional, defines additional parameters for transformation
10
11        # keeps only columns of interest
12        - transformer:            select_columns
13          params:
14              columns_to_include:
15                  - .*_DNA
16                  - .*_RNA
17                  - .*_clinical
18                  - OS
19                  - OS_censor
20
21        # drops rows for which OS and OS_censor are undefined - can't do modeling without targets
22        - transformer:            drop_nan_rows
23          params:
24              columns_to_include:
25                  - OS
26                  - OS_censor
27
28        # drops all columns with %NaNs > 50, except OS and OS_censor
29        - transformer:            drop_nan_columns
30          params:
31              threshold:          0.5
32              columns_to_include: ['.*']
33              columns_to_exclude:
34                  - OS
35                  - OS_censor
36
37        # goes over correlation groups and keeps only one column per group, so that there are no
38        # correlated columns within the result dataset
39        - transformer:            remove_correlated_features
40
41        # applies 'standard' normalization to all numerical columns (except OS and OS_censor)
42        - transformer:            normalize_numericals
43          params:
44              normalization:      standard
45              columns_to_exclude:
46                  - OS
47                  - OS_censor
48
49        # for FMI/vardict data we want to binarize values by keeping only MUT and WT values
50        - transformer:            replace_value
51          params:
52             columns_to_include:
53                 - (.*)_DNA
54             mapping:
55                 AMP:             MUT
56                 WT:              WT
57                 VUS:             WT
58                 SNP:             MUT
59                 DEL:             MUT
60                 REARG:           MUT
61                 HETLOSS:         MUT
62
63        # Remove columns for which #MUT / #(MUT | WT) < 0.05
64        - transformer:            prevalence_filtering
65          params:
66             columns_to_include:
67                 - (.*)_DNA
68              threshold:          0.05
69              # Values that will be used in numerator
70              values:
71                  - MUT
72
73        # applies 'one-hot' encoding to all categorical columns (except OS and OS_censor)
74        - transformer:            encode_categoricals
75          params:
76              encoding:           one_hot
77              columns_to_exclude:
78                  - OS
79                  - OS_censor
80
81        # Apply iterative imputation to replace NaN values
82        - transformer:            mice
83          params:
84              columns_to_include:
85                  - .*
86
87...
For the list of available transformers see Data Transformers.
Correlation Groups Detection
Motivation
Often while conducting data analysis we face with the issue of having correlated columns within dataset of interest. It could cause the following problems:
Some machine learning models have strict requirements regarding presence of correlated features (linear regression model assumes there are little or no multicollinearity in the data)
Having multiple correlated features may slow down the required computations while not necessarily bringing more value to results - as we could just keep only one feature that provides almost the same predictive power / importance and reduce the noise introduced by ‘redundant’ features.
‘Correlation groups’ approach is to address mentioned issues using the following logic:
Some definition of ‘feature A is correlated with feature B’ is set. It includes correlation metric (Pearson, Spearman, etc.), threshold of interest and additional constraints if needed.
Having ‘correlated’ function defined we can create an undirected graph where nodes are features and edges exist only between correlated features.
In order to get a subset of features from the initial dataset so that the correlation issue is resolved we need to find a maximal independent set within the correlation graph.
Configuration
Correlation groups parameters are set via eda section of configuration file. Sample example is
provided below:
 1...
 2eda:
 3    params:
 4        correlation_type:                 spearman
 5        correlation_threshold:            0.8
 6        correlation_min_samples_fraction: 0.2
 7        correlation_key_names:
 8            - TP53
 9            - KRAS
10            - CDKN2A
11            - CDKN2B
12            - PIK3CA
13            - ATM
14            - BRCA1
15            - SOX2
16            - GNAS2
17            - TERC
18            - STK11
19            - PDCD1
20            - LAG3
21            - TIGIT
22            - HAVCR2
23            - EOMES
24            - MTAP
25...
Please see logml.configuration.eda.EDAArtifactsGenerationParameters class for
the details.
After all required correlation groups parameters are properly set and presumably the correlation EDA artifact
will be generated a transformer remove_correlated_features can be used in data preprocessing steps of interest (
at the moment only within ‘modeling’ and ‘survival_analysis’ sections):
 1...
 2modeling:
 3    problems:
 4        y_regression:
 5            dataset_preprocessing:
 6                steps:
 7                  ...
 8                  - transformer: remove_correlated_features
 9                  ...
10            ...
11...
Please see logml.feature_extraction.transformers.filtering.CorrelatedColumnsFilteringTransformer class
for the details.
Correlation groups review
Information on how the result correlation groups look like can be found in “EDA / Continuous Features: Distribution and Correlation” report section.
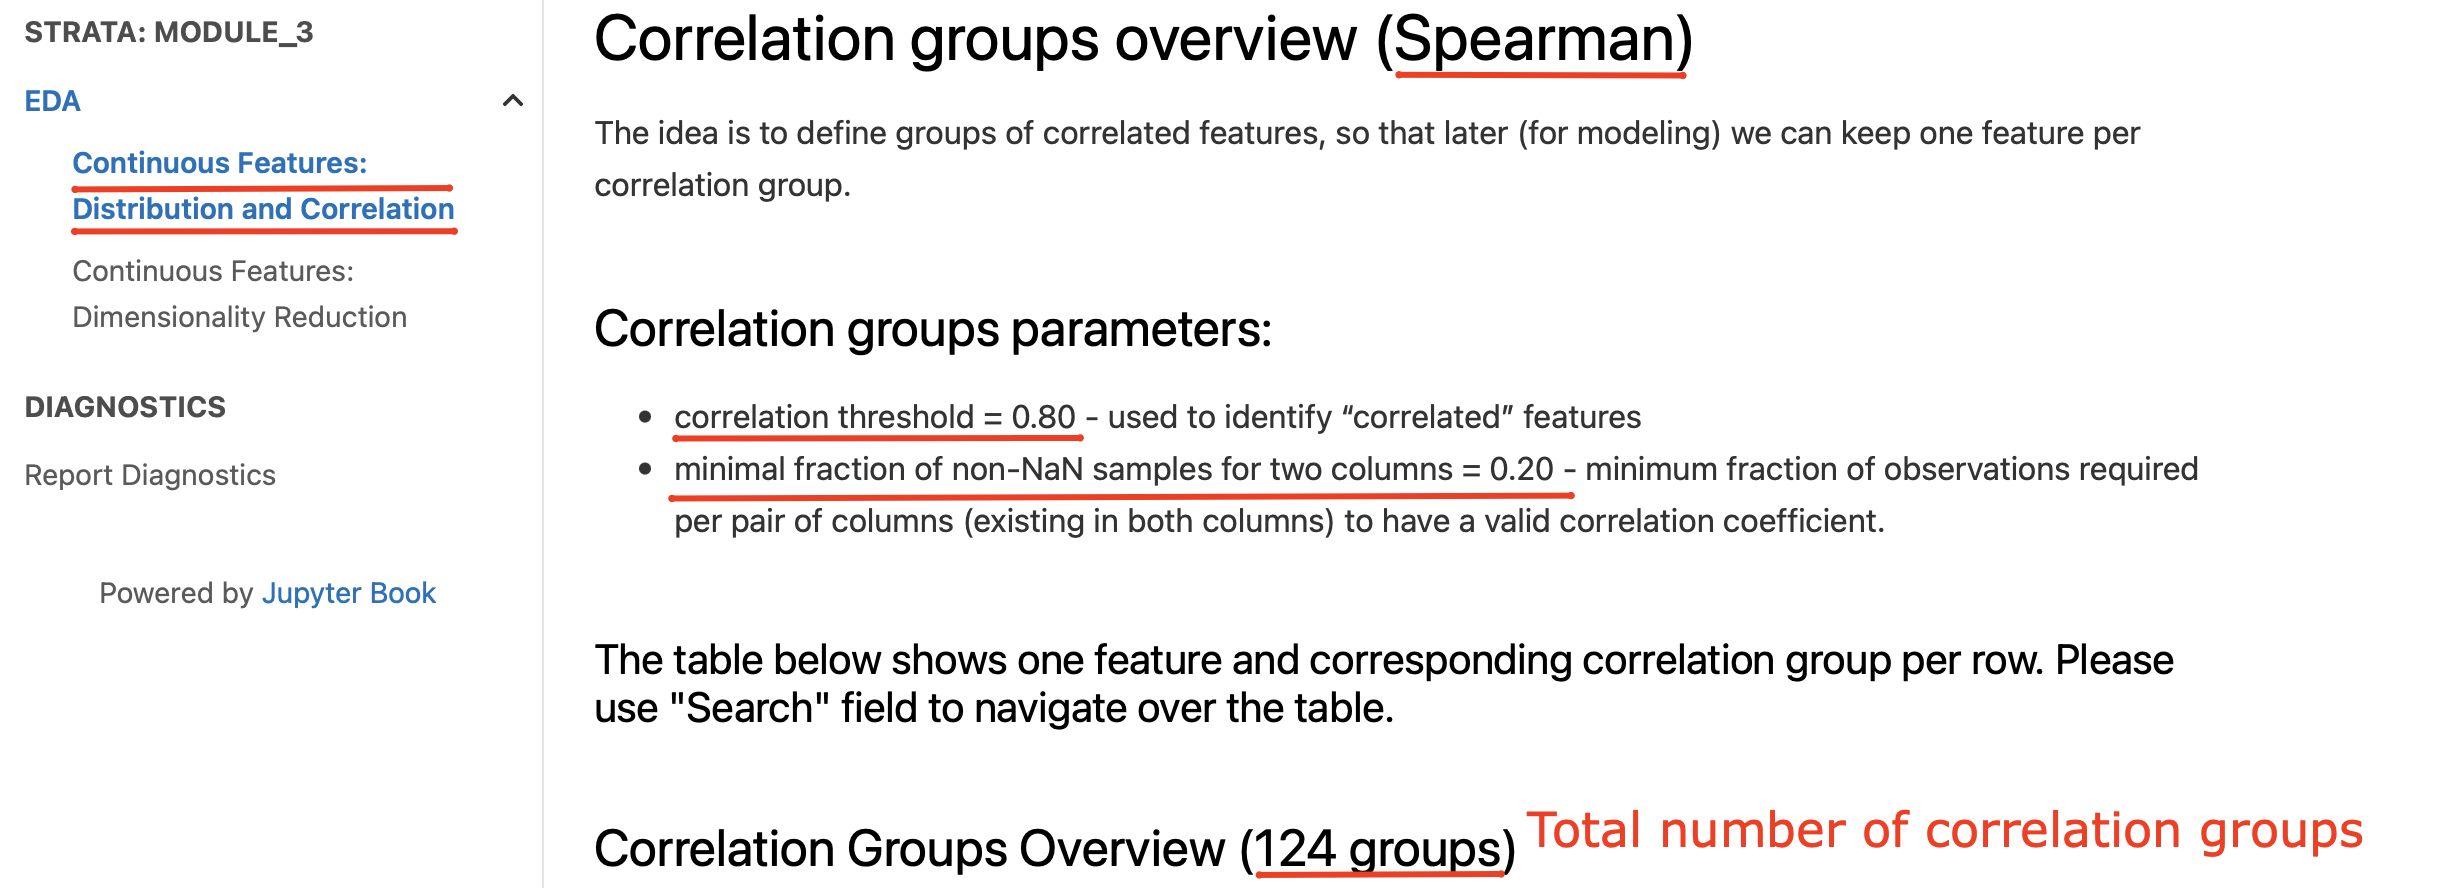
In addition to the high-level summary of the provided parameters the section contains an interactive table that could help to understand the correlation groups:
Search by correlation group name
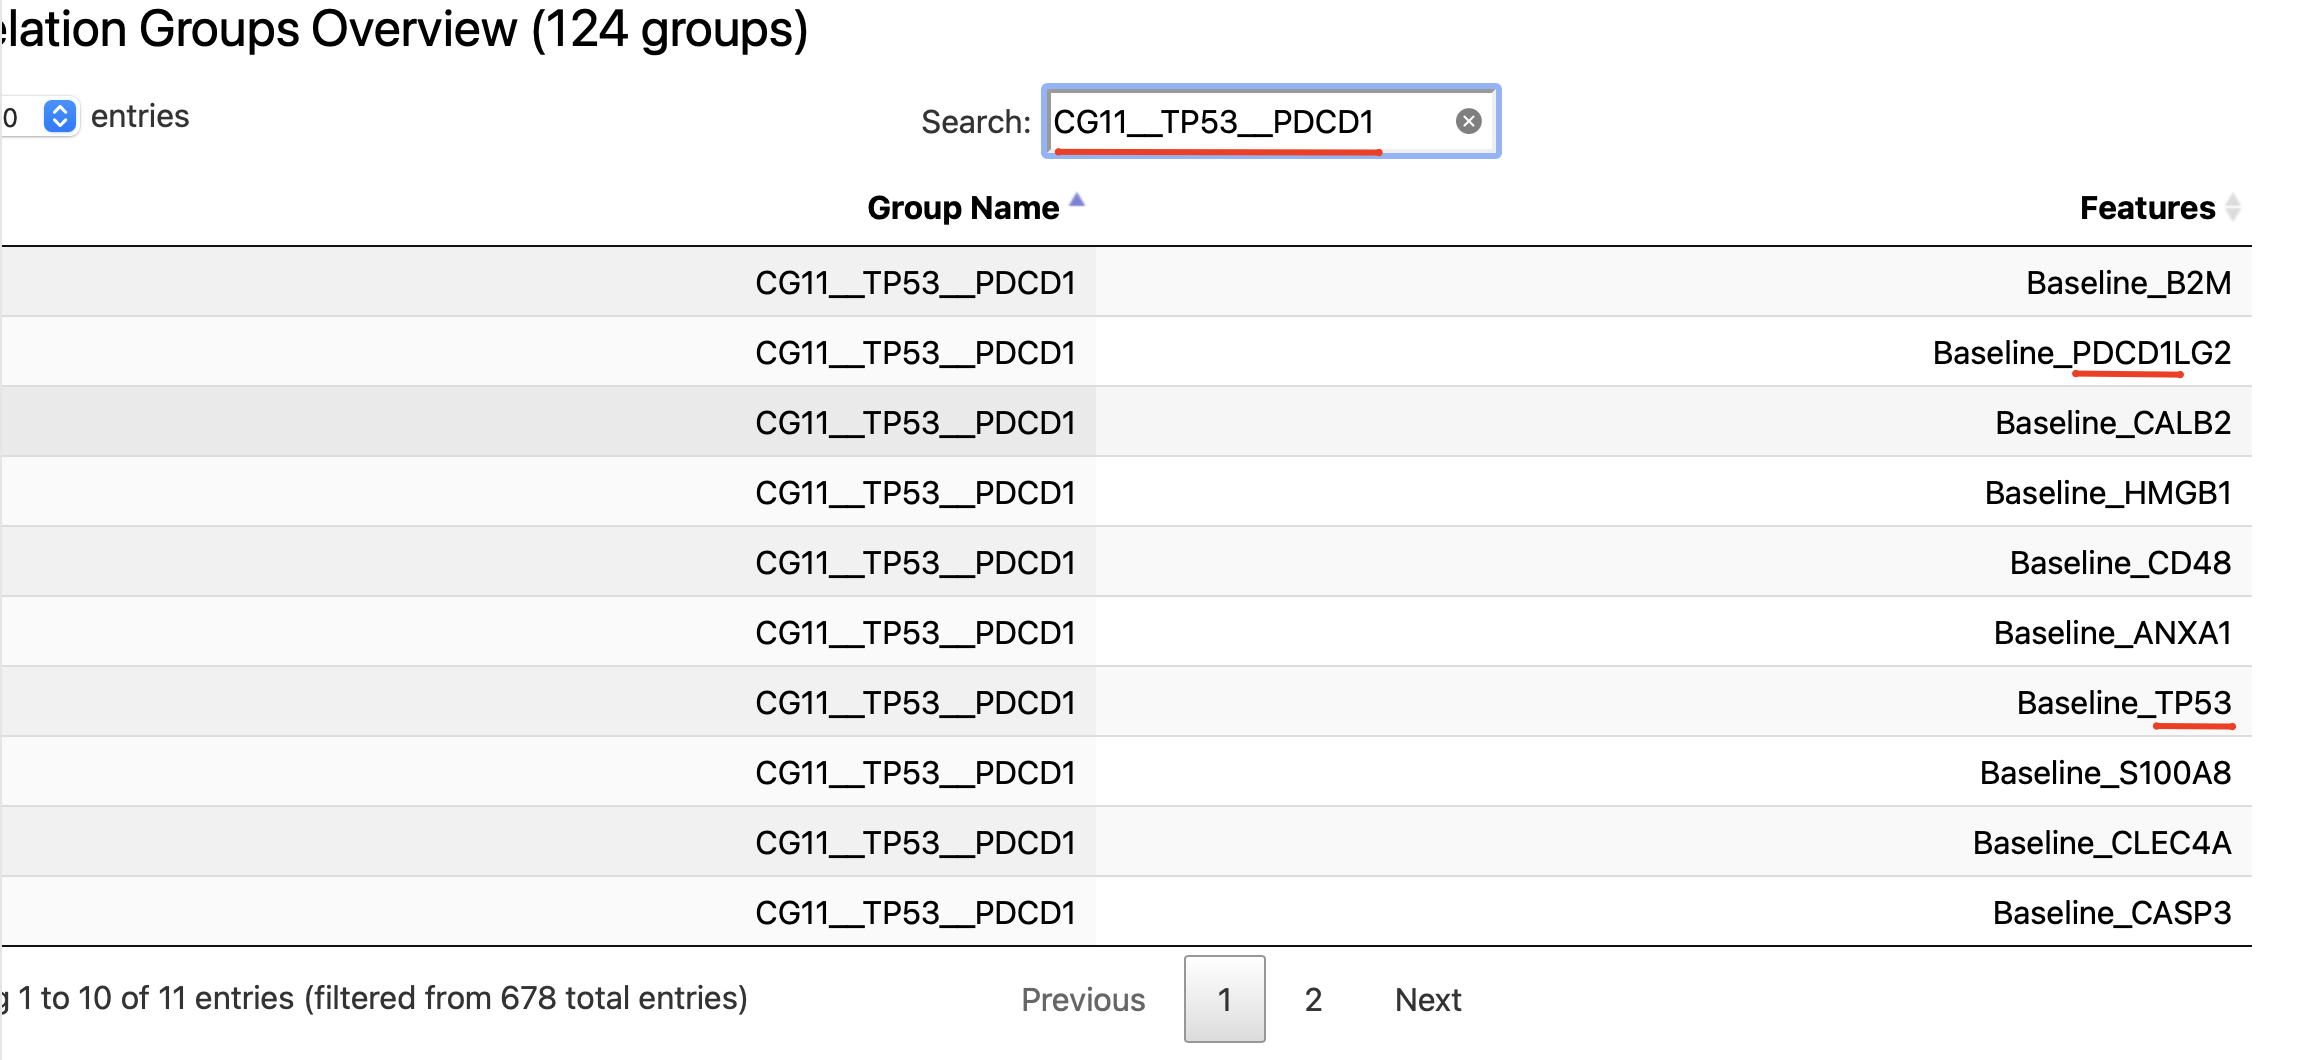
Search by feature name
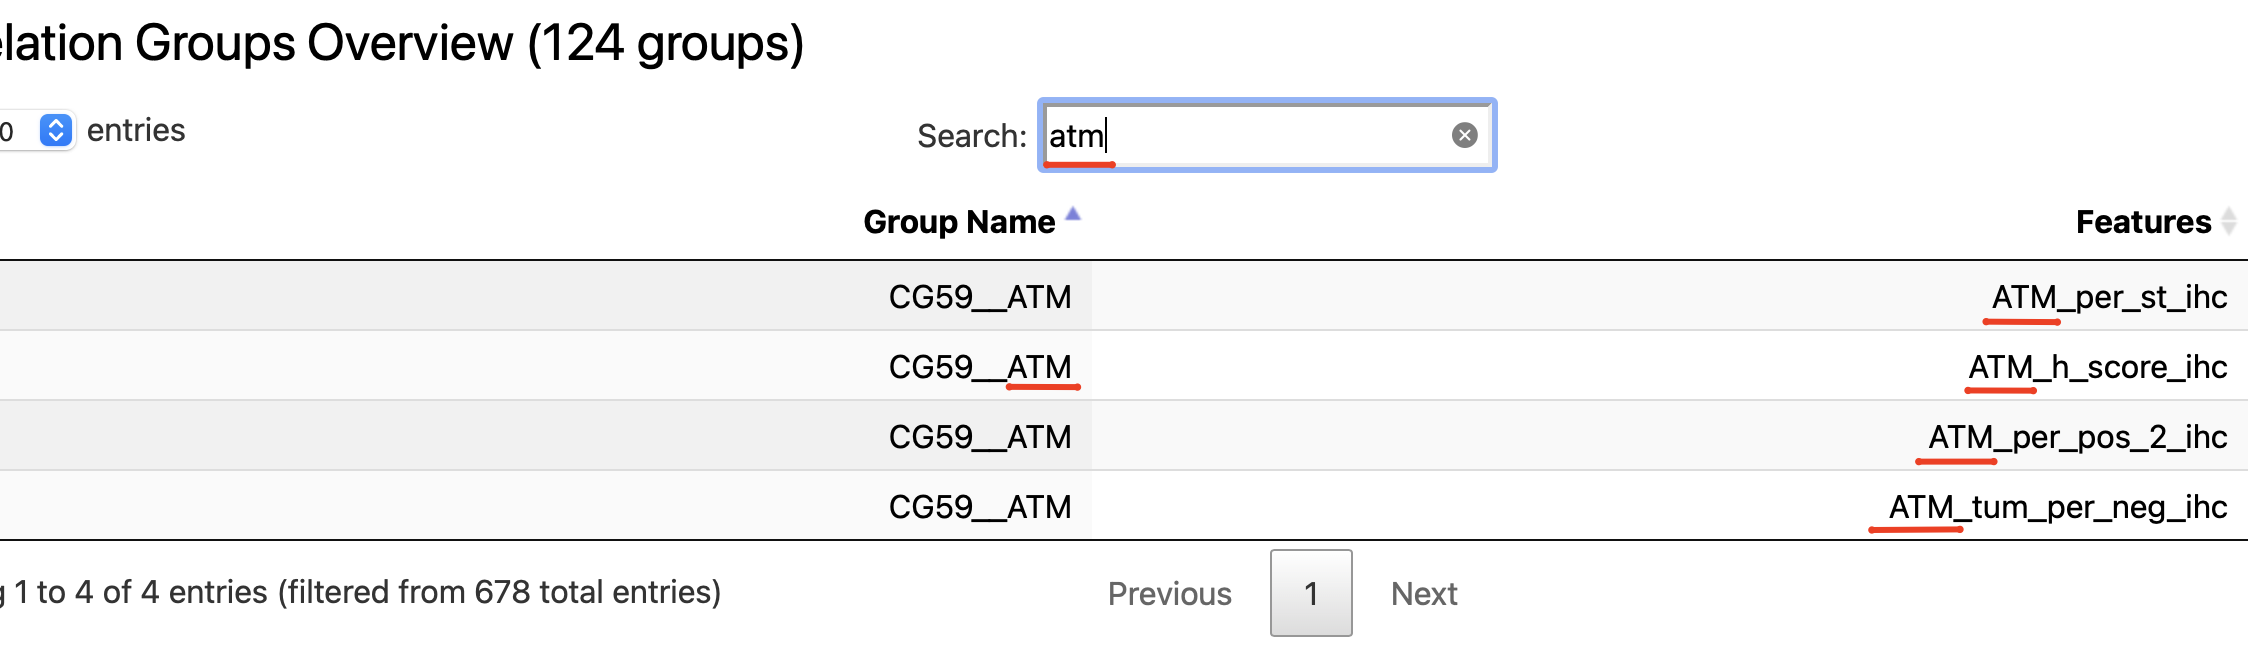
So in case there is a need to understand what features are within some correlation group of interest (found either in modeling results or survival, if was enabled) - the described above EDA subsection could be used.
Implementation details
Correlation groups creation
As part of EDA artifacts generation there is produced logml.eda.artifacts.correlation.CorrelationSummary
object that stores information about correlation groups:
correlation_groupsproperty contains a correlation graph that was created under all parameters/constraints discussed above (seelogml.eda.artifacts.correlation.CorrelationGraphfor details)correlation_groupsproperty contains a list of correlation groups that were defined (seelogml.eda.artifacts.correlation.CorrelationGroupfor details)
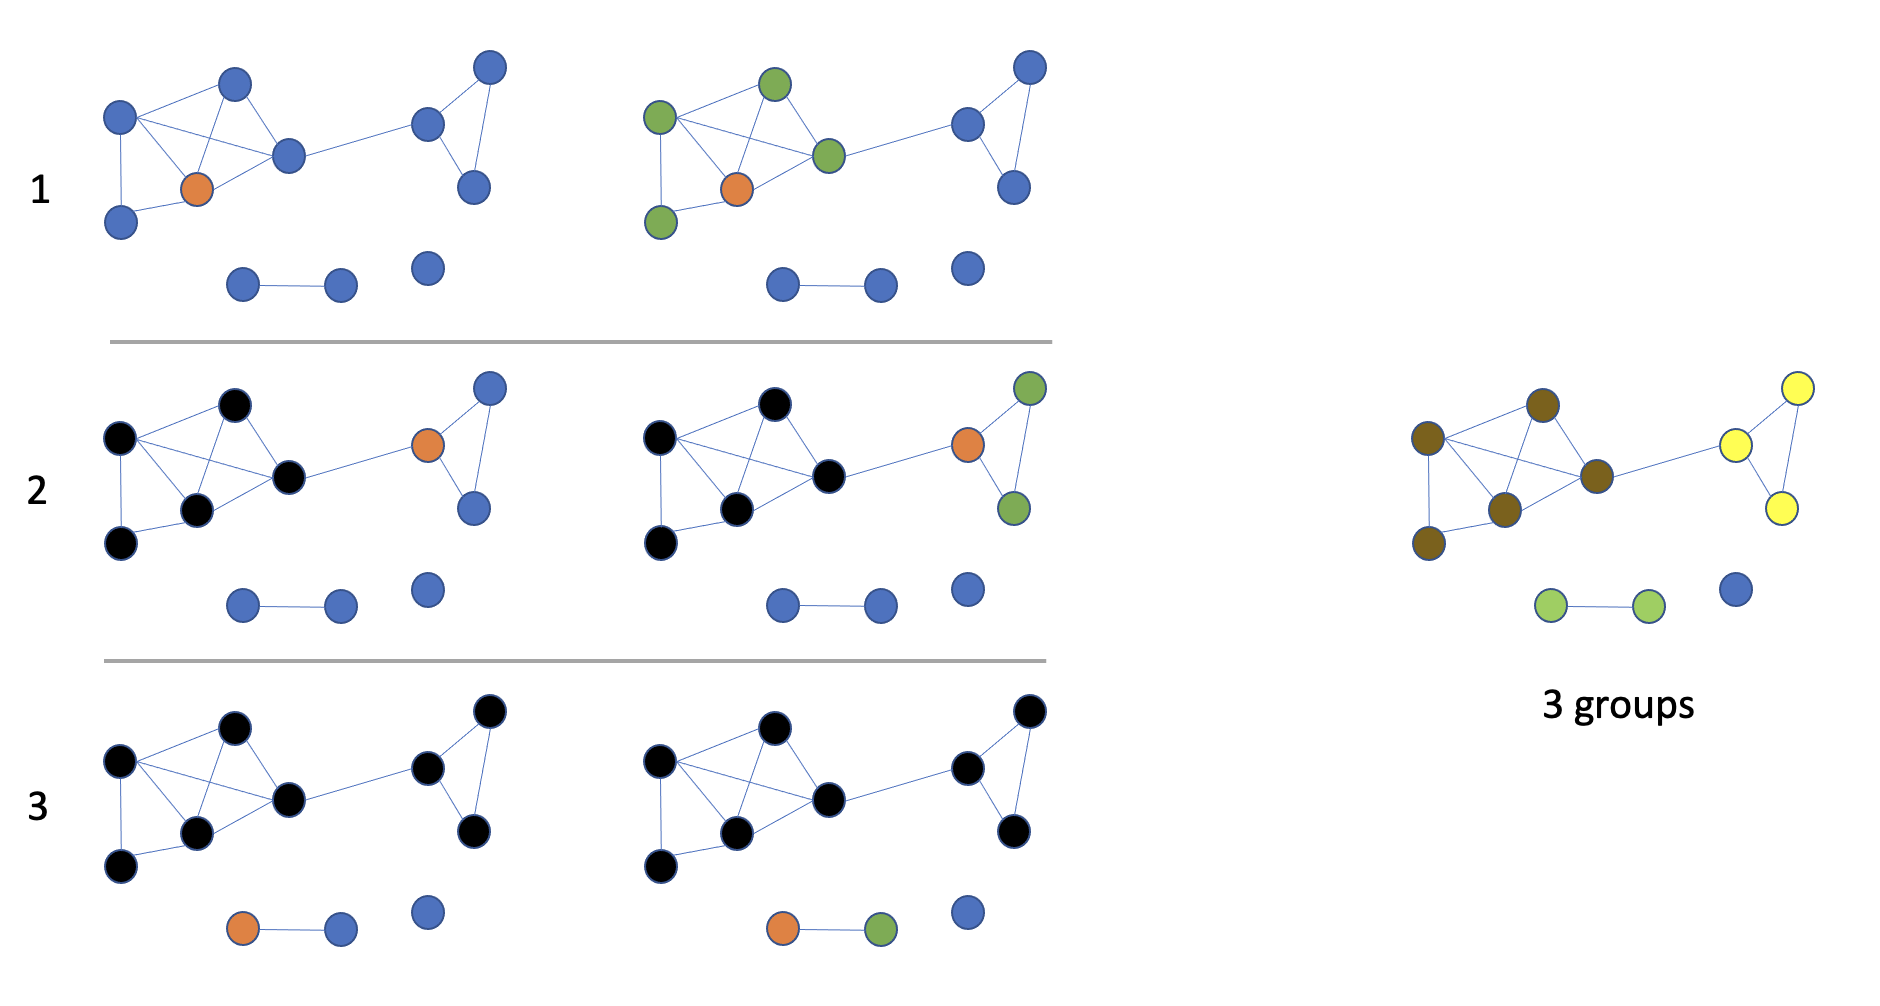
The main goal of correlation groups definition is to facilitate the process of removing correlated features (via the corresponding data preprocessing step) - so we want to find a (maximal) subset of features so that within that subset there are no correlated features. In order to do that the following approach is proposed:
Features are processed in order that is defined by corresponding node degrees in the correlation graph (descending)
Until all features/nodes are processed the next feature is picked (in case it has adjacent unmarked nodes) and a new correlation group is assigned to it. All adjacent and unmarked nodes are assigned to the same correlation group as well.
Please see the example below that shows the described approach:
Removing correlated features
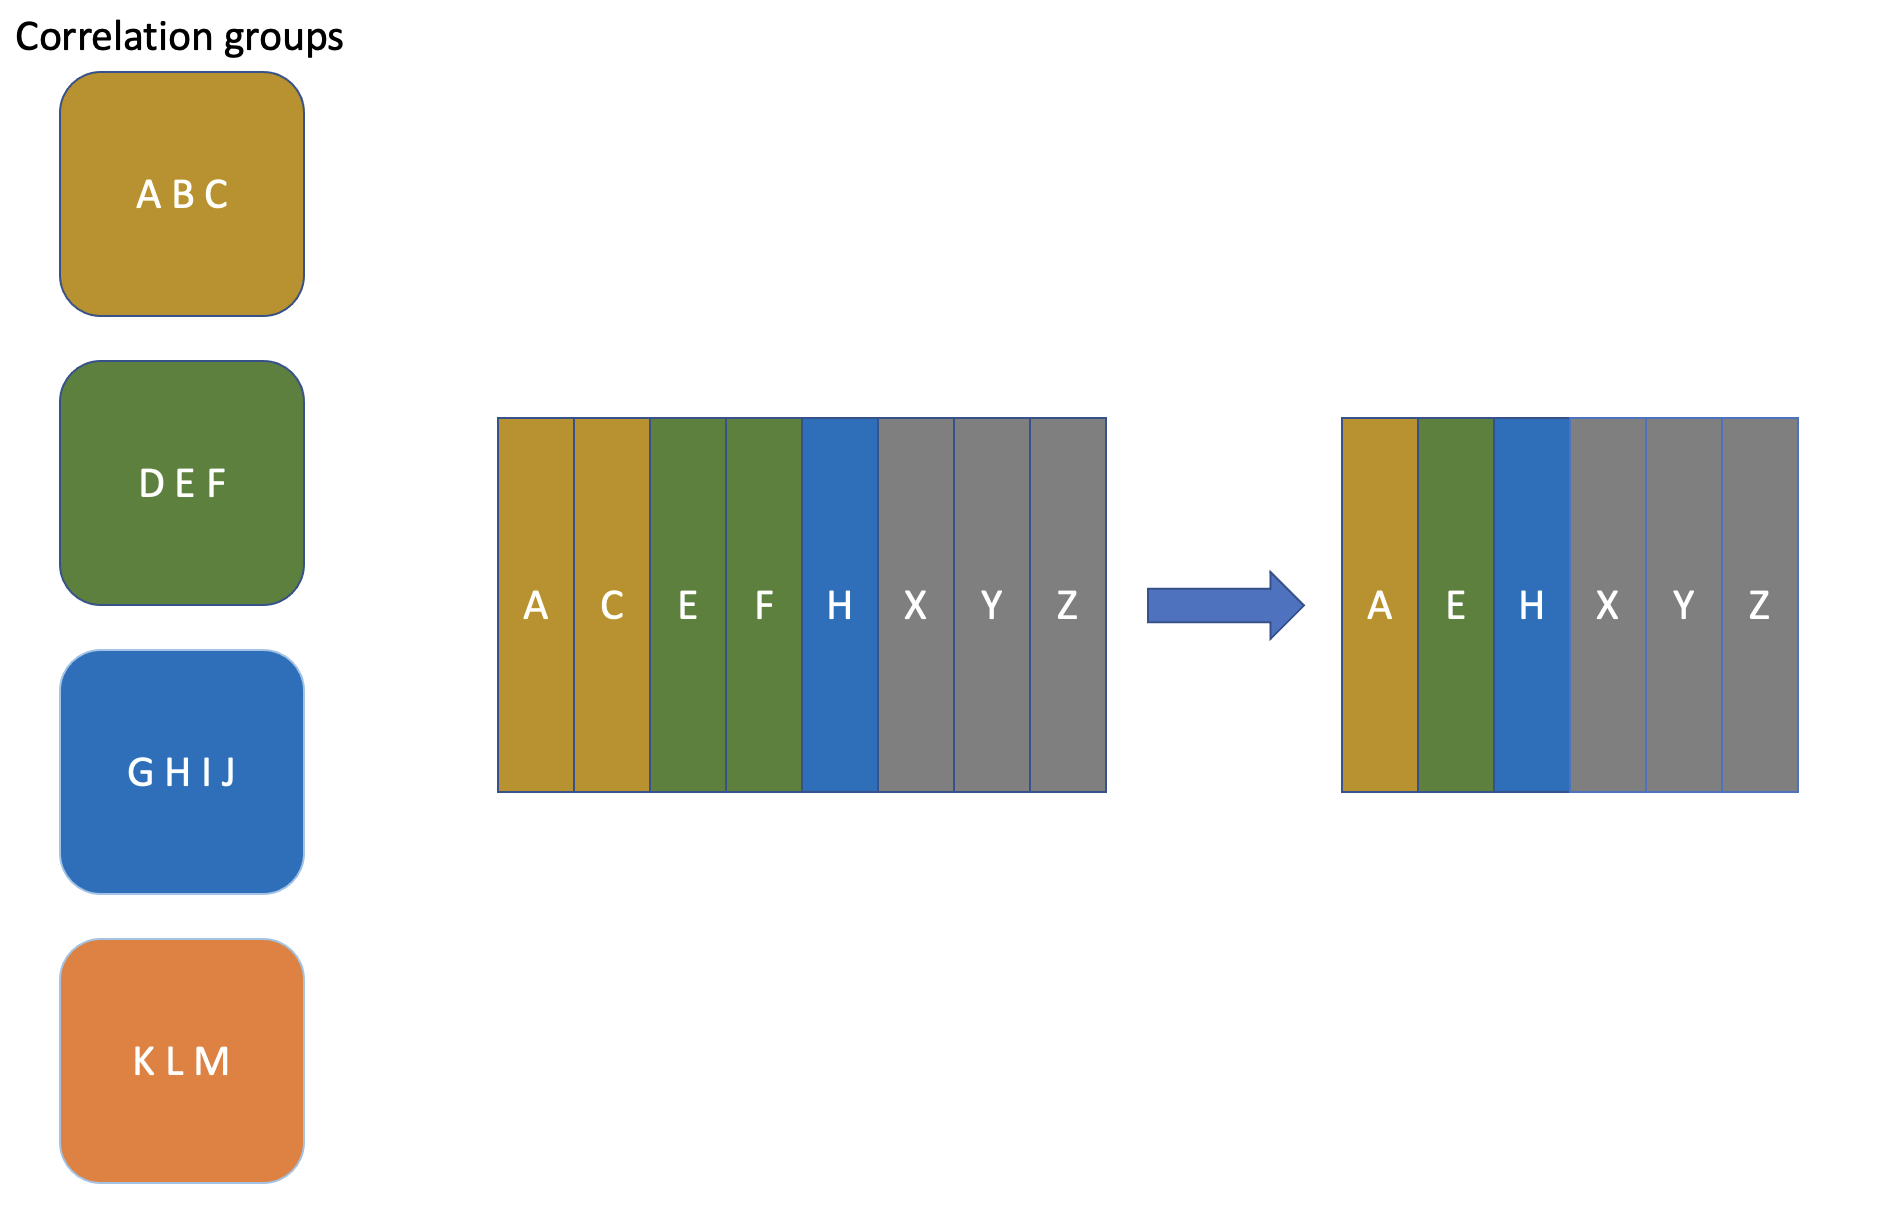
As it was mentioned in case correlation featured should be removed within some data preprocessing -
remove_correlated_features transformer does the job. It implements the following logic:
“target” column is not affected (for survival - both “event” and “time” columns)
all correlation groups are sequentially checked: if for a correlation group there are some features within current dataset - only one feature is kept and others are filtered out
Please see the example below that shows the described approach: